
|
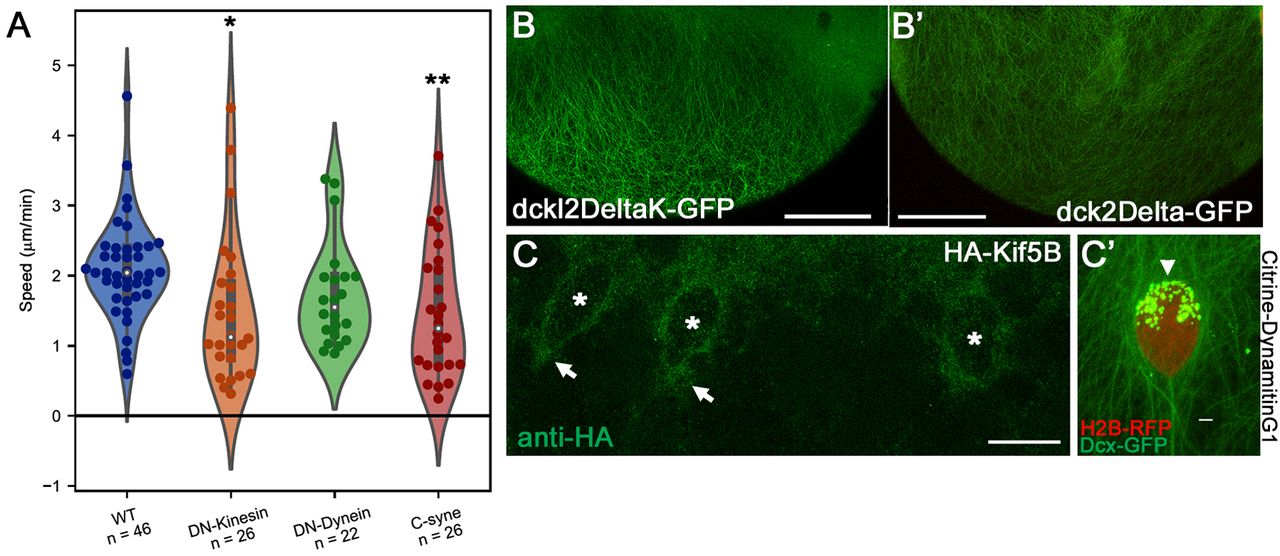
Fig. 5
Knockdown of kinesin and dynein decrease e-YSN migration speeds. (A) Violin plot of e-YSN migration speeds: medians indicated by white dots, thick gray lines indicate interquartile ranges, thin gray lines indicate 95% confidence intervals. Mean speeds: wild-type YSN (WT): 2.082±0.259 μm/min; Klc1 (DN-Kinesin): 1.485±0.483 μm/min; DynamitinG1 (DN-Dynein): 1.711±0.380 μm/min; and C-syne2a (C-syne): 1.465±0.427 μm/min. (B-B′) Confocal projections of Tg:(XlEef1a1:dclk2DeltaK-GFP)-injected embryos at late epiboly injected with GFP-Klc1 (B) or Citrine-DynamitinG1 (B′) showing normal microtubule organization. (C) HA antibody staining showing localization of HA-Kif5Ba around migrating e-YSN (asterisks) and leading tip (arrows). n =16. (C′) Citrine-DynamitinG1 puncta decorating an e-YSN labeled in red. Arrowhead indicates lagging side which is enriched with puncta. n=12. Scale bars: 70 µm in B; 90 µm in B′; 19 µm in C; 3 µm in C′.