
|
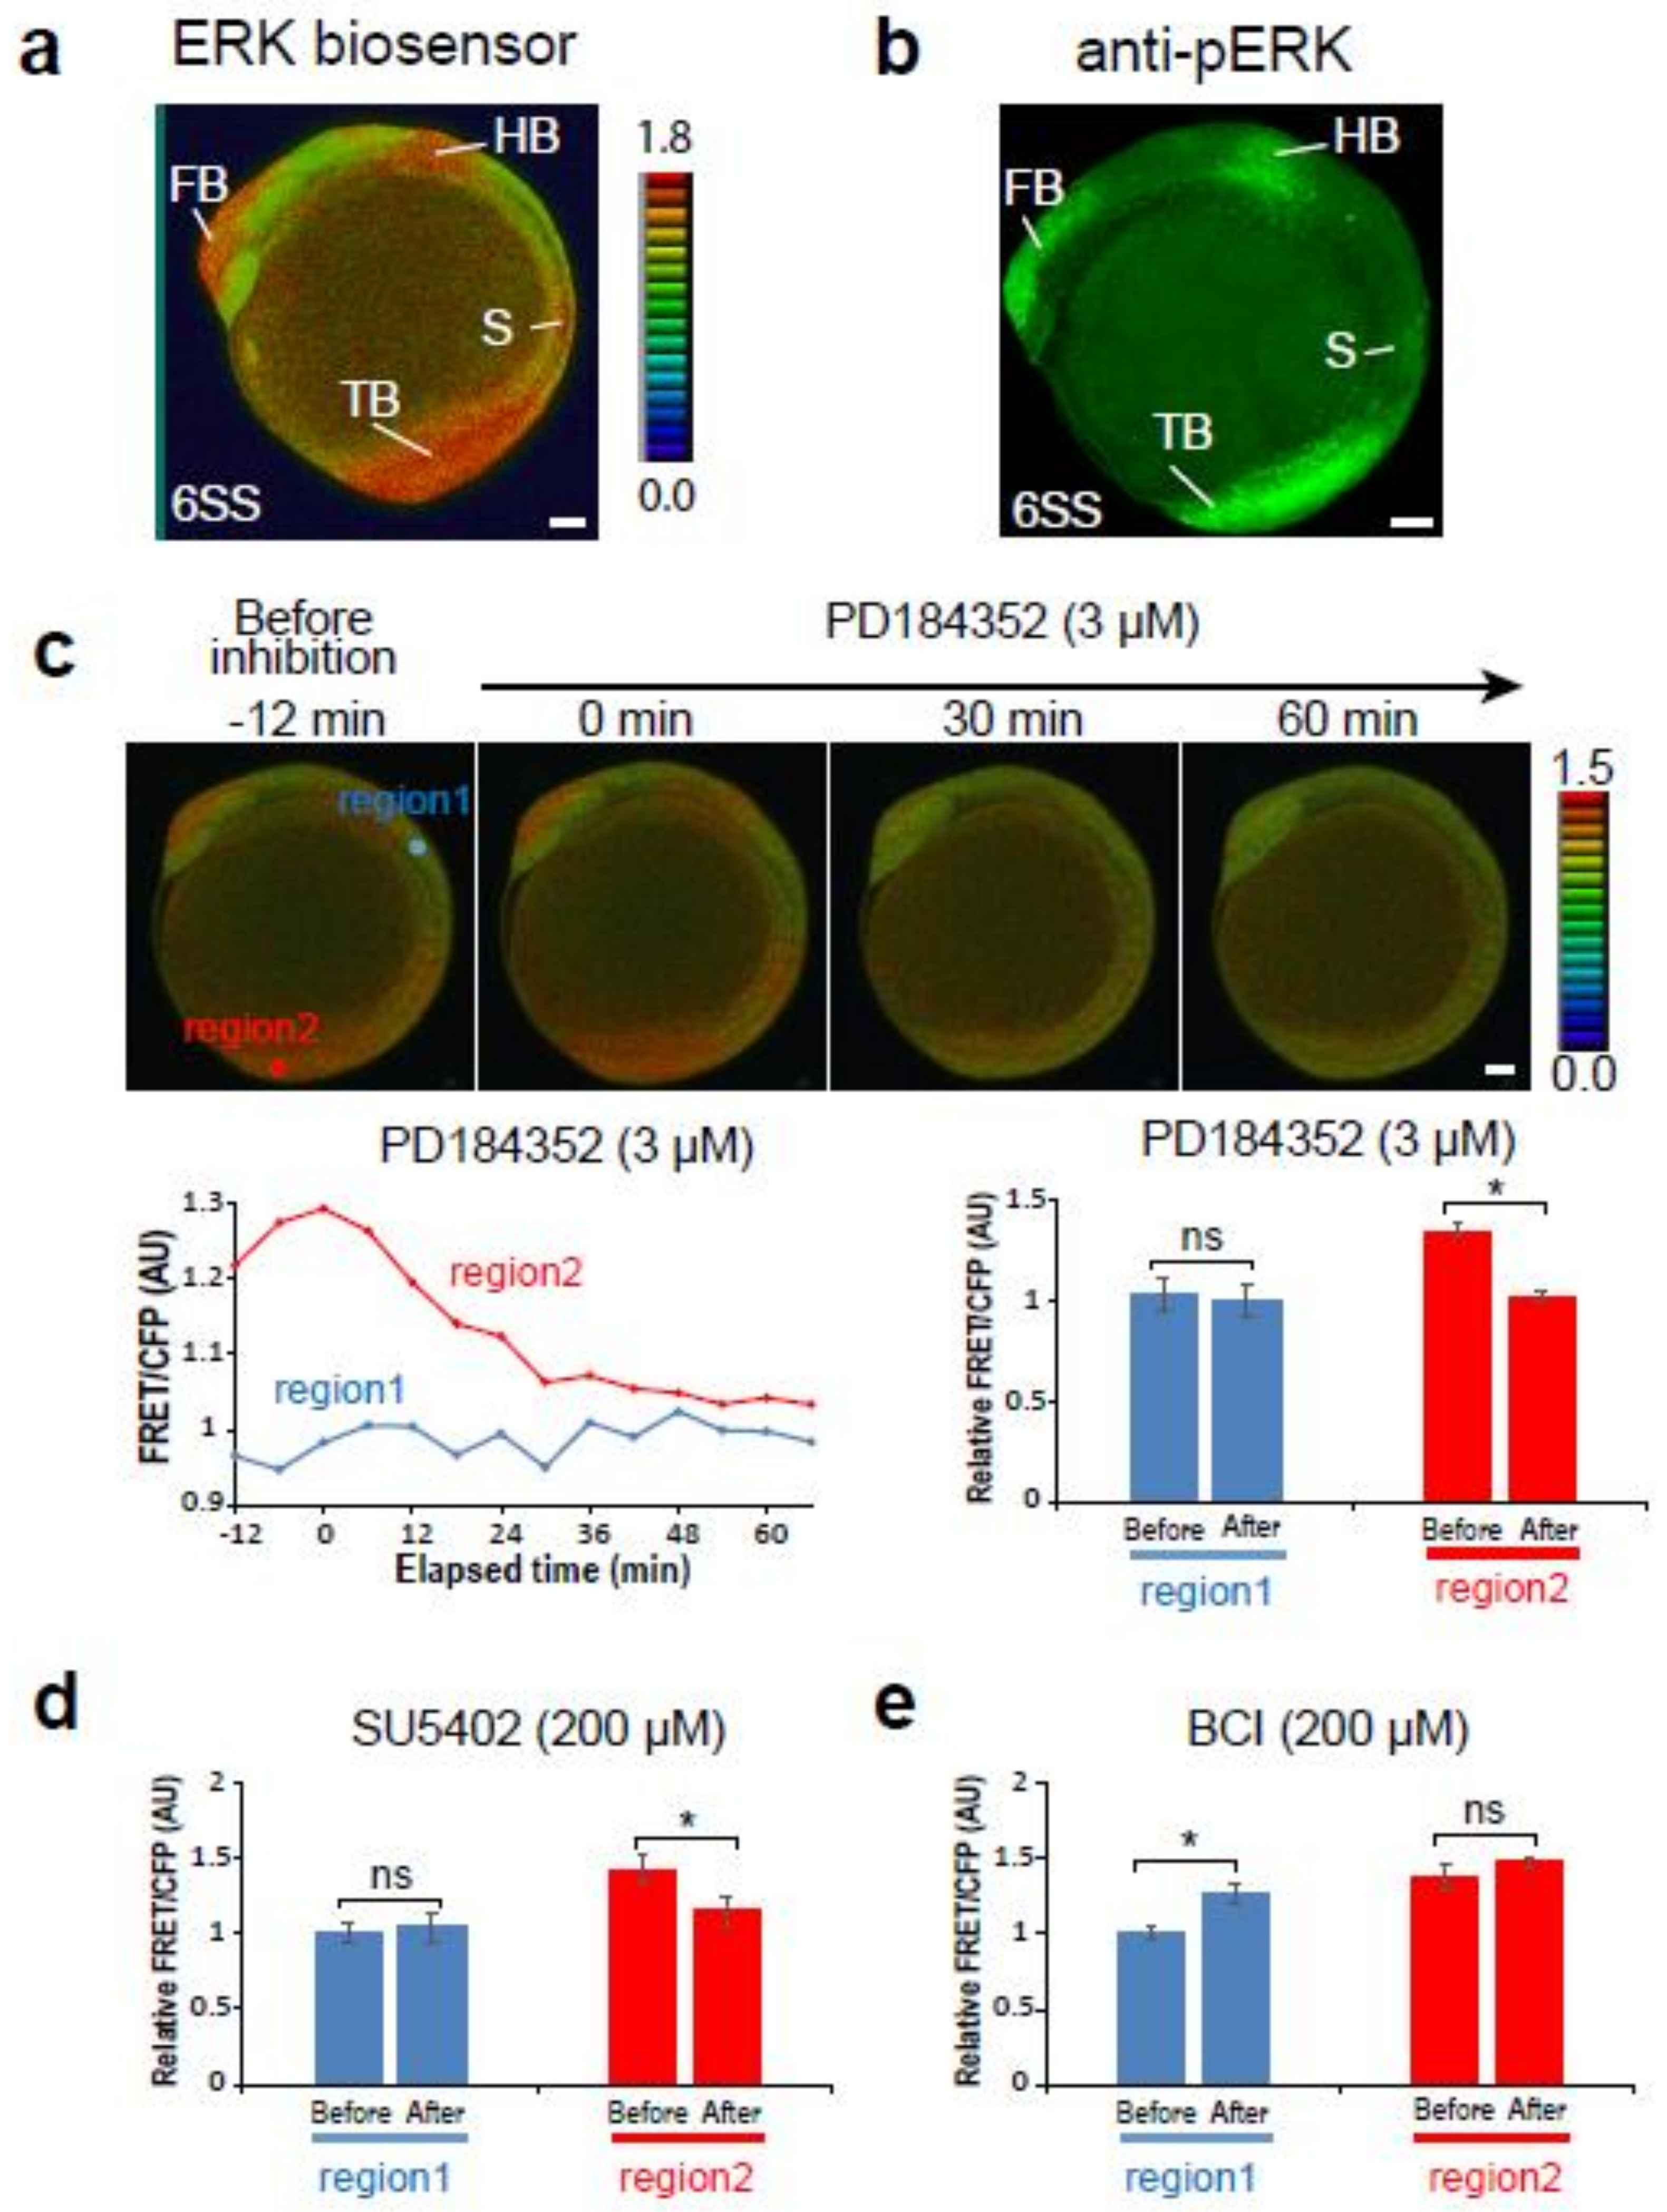
Fig. 1
The Teen allowed monitoring of extracellular signal-regulated kinase (ERK) activity in living zebrafish embryos. (a, b) ERK activity detected by the ERK biosensor (8-color heat map) (a) or an anti-pERK antibody (green); (b) lateral view. Scale bar, 50 m. FB, forebrain; HB, hindbrain; S, somite; TB, tail bud. (c–e) Changes of ERK activity in 6-somite stage Teen embryos treated with the MEK inhibitor (3 M PD184352, n = 3) (c), the Fgf receptor inhibitor (200 M SU5402, n = 3) (d), or the ERK phosphatase inhibitor (200 M BCI, n = 3) (e). Region 1, a region between the hindbrain and first somite; region 2, tail bud. Before, 0 min; after, 60 min. * p < 0.05; ns, not significant; error bars, standard deviation.