
|
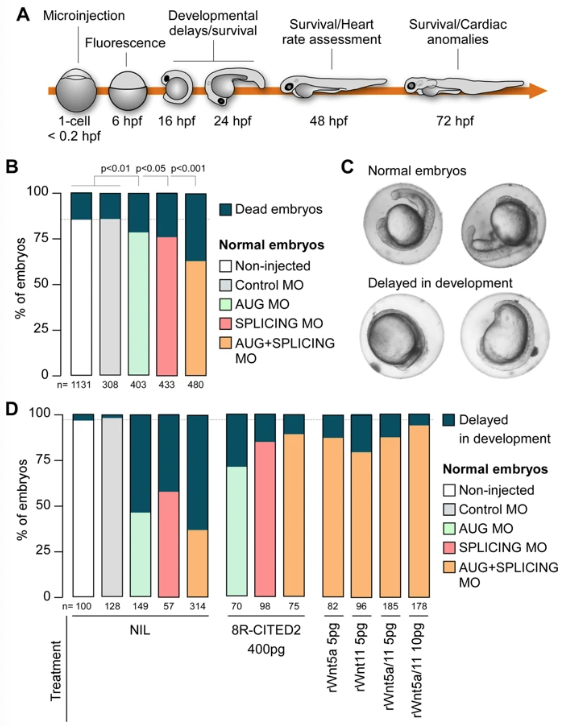
Fig. 4
a Schematic representation of the experimental steps and analysis performed with zebrafish embryos. The timings of development are indicated in hours post fertilization (hpf). bPercentage of embryos which are normal or dead at 24 hpf, after injection of 5 ng (0.7 pmol) of control morpholino (Control MO), anti-cited2 morpholinos targeting either the transcriptional start site (AUG MO; 5 ng) or the splicing site in the exon 1 (SPLICING MO; 5 ng), simultaneously with AUG MO and SPLICING MO (AUG+SPLICING MO, 2.5 ng of each morpholino), as well as non-injected embryos (Non-injected). Statistical significance was determined against control embryos using Student’s t test. c Brightfield images of live embryos showing the representative morphological features of zebrafish embryos considered as normal (top panel) or delayed in development (bottom panel) at 20 hpf. d Percentage of embryos which are normal or delayed in the developmental process at 20 hpf, after injection of morpholinos as described in b, in the presence of 400 pg of recombinant CITED2 protein (8R-CITED2), rWnt5a and rWnt11 alone (5 pg) or in combination (rWnt5a/11) in a final amount of 5 pg (2.5 pg each) or 10 pg (5 pg each), or no treatment (NIL). In panels, b and d n represents the number of embryos analyzed in each condition in at least 3 independent experiments