
|
Fig. S4
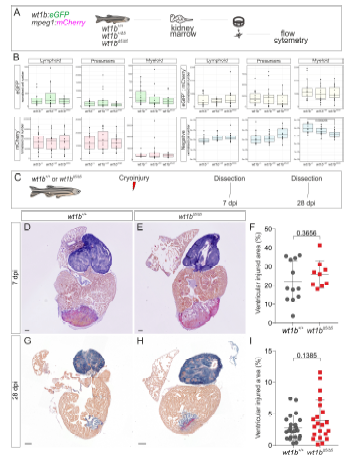
Phenotypic characterization of wt1bΔ5 mutants. Related to Figure 4 and Figure 5. Composition of the whole kidney marrow cell populations in wt1bΔ5 mutants. A, Whole kidney marrow (WKM) cells of wt1b+/+, heterozygous wt1b+/Δ5 or homozygous wt1bΔ5/Δ5 crossed into a Tg(wt1b:eGFP; mpeg1:mCherry) background fish were isolated. This is the same experiment as described in Figure 4, but here, eGFP+, mCherry+, double positive populations and the non-fluorescent fraction were analyzed by flow cytometry separately. B, Shown are boxplots of normalized cell numbers of cell populations in gate 1 (lymphoid), 2 (precursors) or 3 (myeloid). Normalized cell numbers relate to cell numbers per 106 events of living single cells. Negative (non-fluorescent) cell numbers in gate 3 are significantly lower in wt1bΔ5/Δ5 than in wt1b+/+ by one-way ANOVA followed by a Tukey’s post-hoc test. C-I, Fibrotic tissue deposition and regeneration in wt1bΔ5 mutants. C, Ventricular cryoinjury was performed to wt1b+/+ and wt1bΔ5/Δ5 adult fish and fibrosis assessed at 7 and 28 dpi on sectioned hearts using AFOG histological staining to detect collagen. D, E, Representative sagittal section of a wt1bΔ5/Δ5 and wt1b+/+ heart stained with AFOG at 7dpi. F, Quantification of injured area versus total ventricular area. Data from two independent experiments. Two-tailed unpaired t test. G-I, Representative images and quantification of injured cardiac ventricular area at 28 dpi, as shown in D-F. Two-tailed unpaired t test. dpi, days postinjury. Scale bars, 100 μm.