
|
Fig. S1
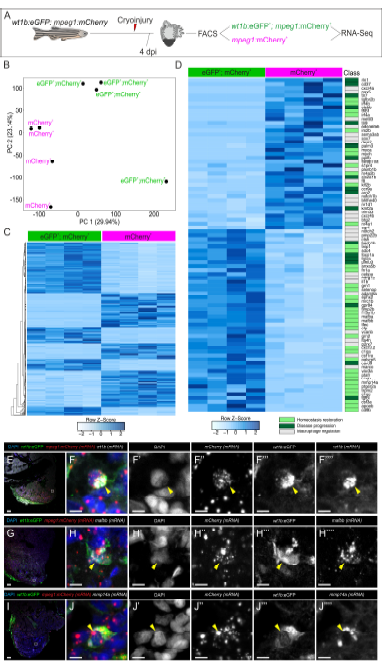
Differential gene expression of wt1b -positive macrophages. Related to Figure 2 and Table S1. A, wt1b:eGFP+;mpeg1:mCherry+ and mpeg1:mCherry+ cells were FAC-sorted from cryoinjured adult zebrafish hearts at 4 dpi and their transcriptomes analyzed using RNA-seq. B, Principal component analysis of wt1b:eGFP+; mpeg1:mCherry+ and mpeg1:mCherry+ cells. C, Heatmap indicating all significant differentially expressed genes between both populations. D, Heatmap of genes from (C) whose function has been described in macrophages. Classification of gene function in macrophages according to literature: grey, genes involved in macrophage regulation including differentiation, phagocytosis and apoptosis; light green, genes involved in homeostasis restoration; dark green, genes involved in disease progression. E-J’’’’, Validation of RNA-seq target genes by RNAScope in situ hybridization followed by anti-GFP immunostaining on cryoinjured wt1b:eGFP; mpeg1:mCherry heart sections at 4 dpi. Signal from wt1b, mafbb and mmp14a antisense riboprobes co-localizes with mCherry mRNA and eGFP signal (arrowheads). Note that large dots for mCherry channels represent background staining, and small dots correspond to signal. dpi, days post injury; FACS, fluorescenceactivated cell sorting; PC, principal component; Mφ, macrophage. Scale bars, 50 μm (E, G, I) and 5 μm (F-F’’’’, H-H’’’’ and J-J’’’’).