
|
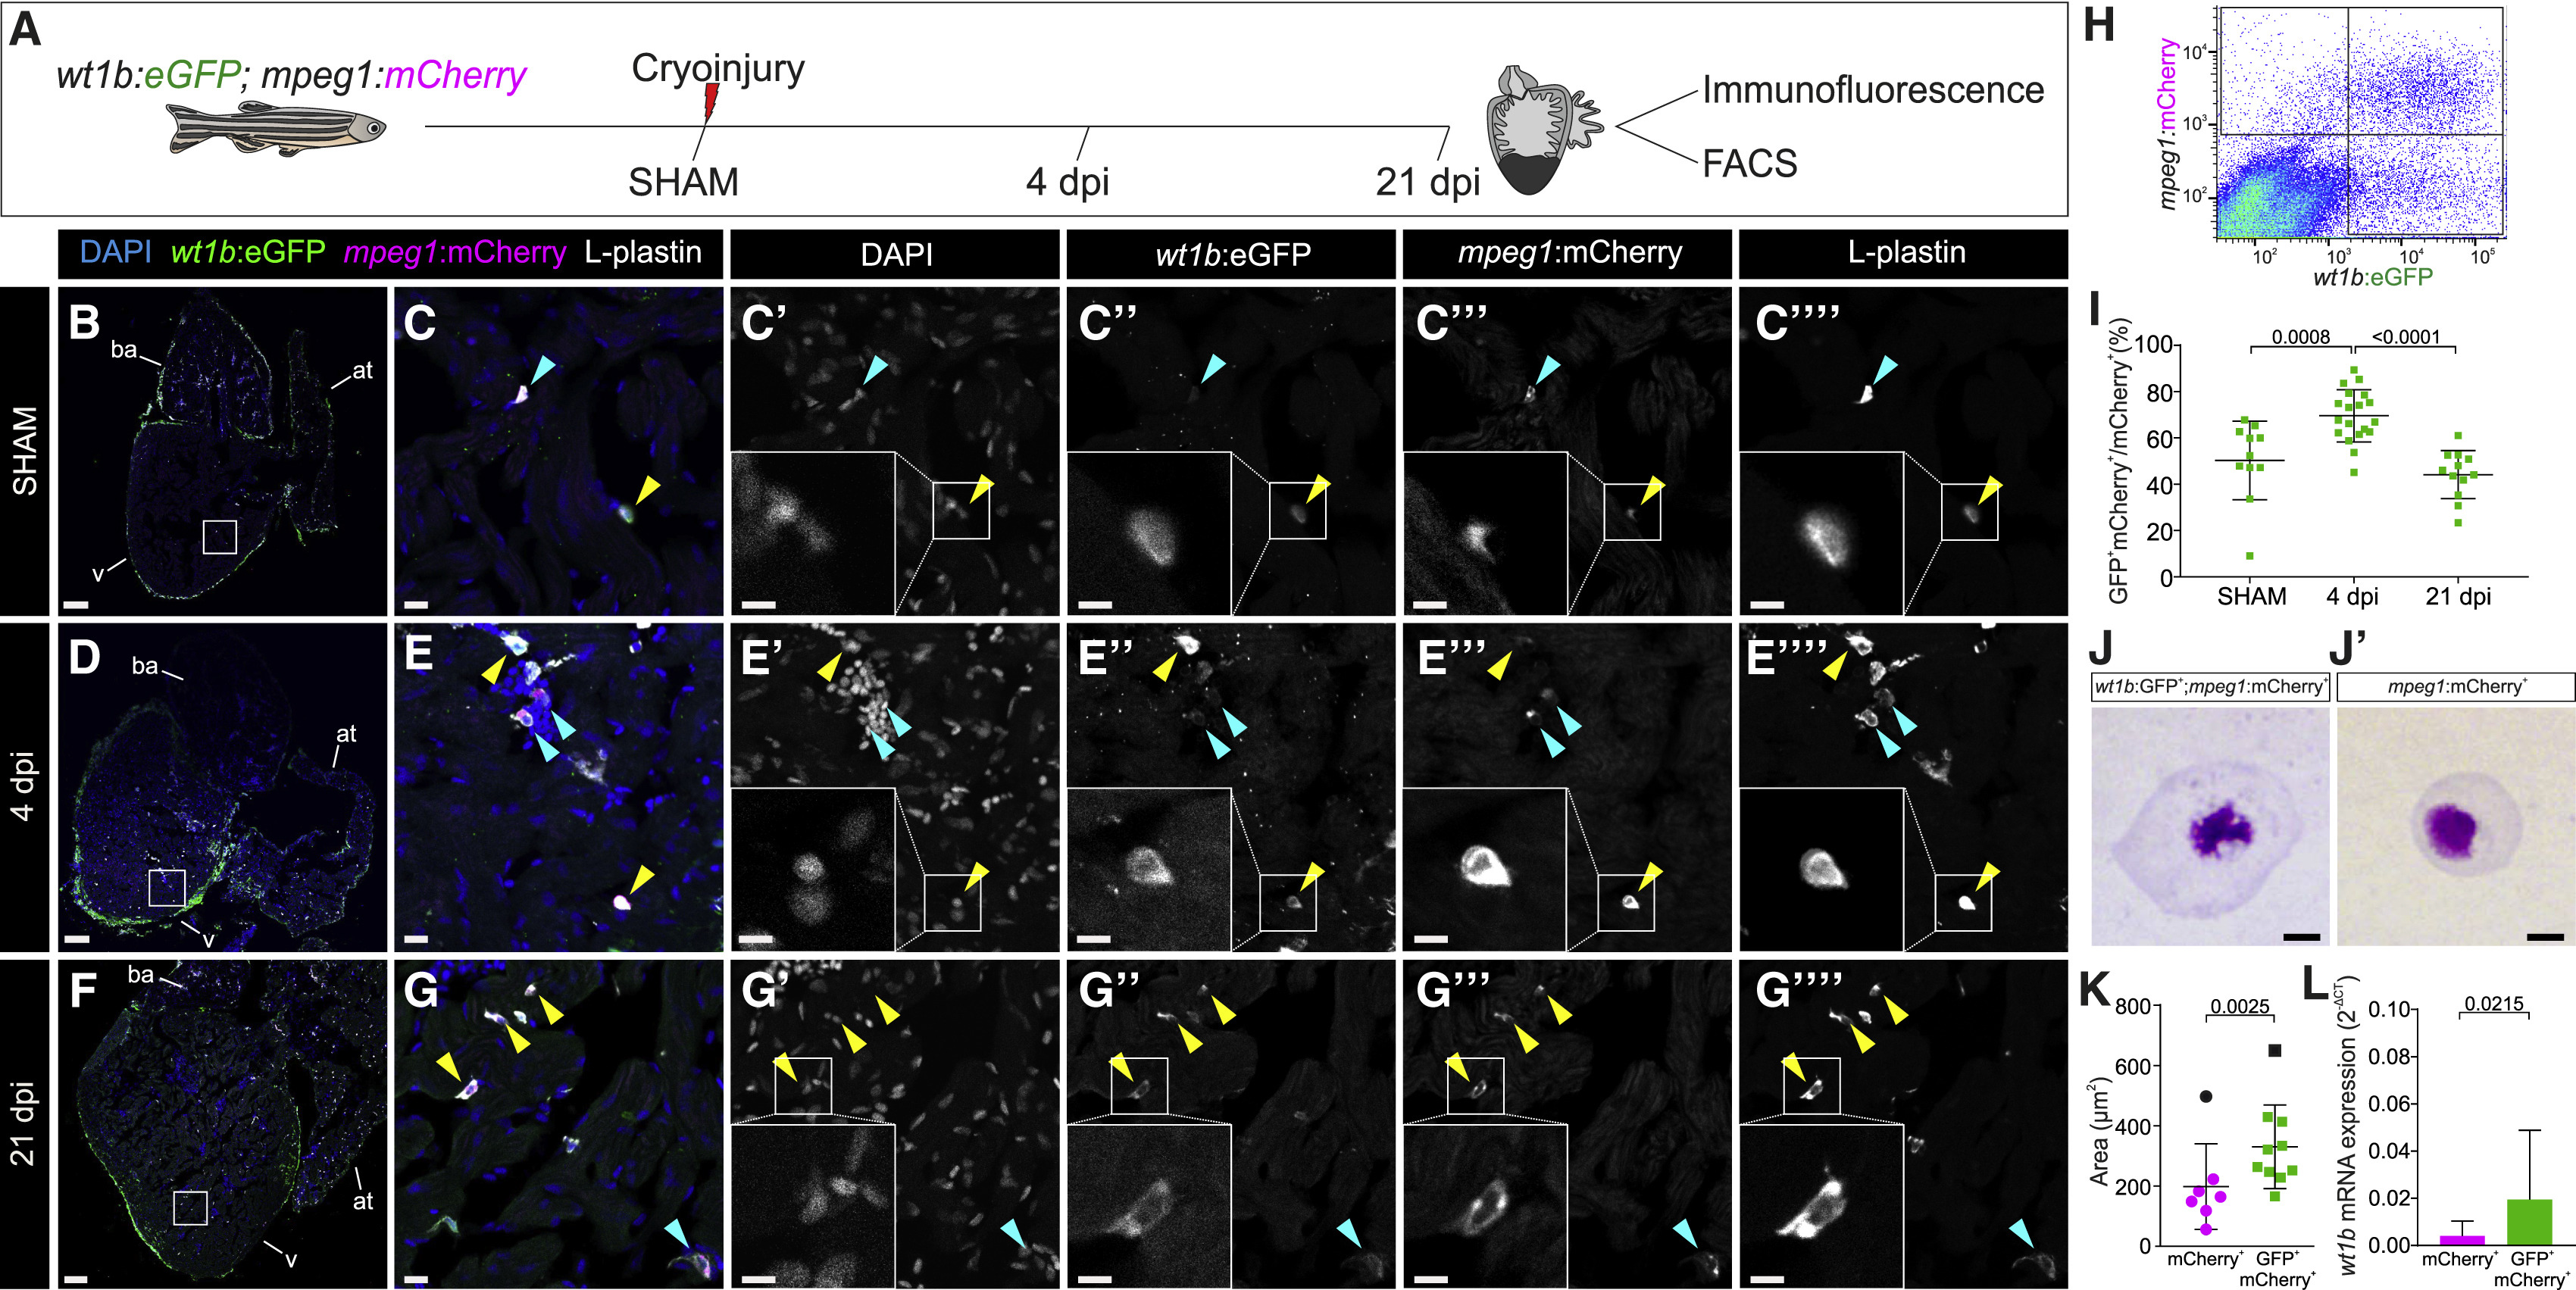
Fig. 1
wt1b:eGFP Expression Defines a Population of mpeg1:mCherry+ Cells in the Zebrafish Heart
(A) Tg(wt1b:eGFP;mpeg1:mCherry) adult zebrafish were cryoinjured and hearts were collected to perform FACS or immunofluorescence (IF) staining.
(B–G’’’’) IF on heart sections. The yellow arrowheads indicate eGFP+;mCherry+;L-plastin+ cells, and the blue arrowheads indicate mCherry+;L-plastin+ cells. (B), (D), and (F) are whole-heart views, remaining panels are zoomed views showing merged (C, E, and G) or single channels. Representative images from sham (n = 7), 4 dpi (n = 14), and 21 dpi (n = 8) processed hearts from 2 experimental replicates are shown.
(H) Representative scatterplot of FACS-sorted cells from Tg(wt1b:eGFP;mpeg1:mCherry) hearts at 4 dpi.
(I) Quantification of flow cytometry data showing the percentage of eGFP+;mCherry+/mCherry+ cells at different time points. Statistical significance is calculated by one-way ANOVA, followed by Tukey’s multiple comparisons test. Two experimental replicates are shown.
(J and J’) May-Grünwald and Giemsa histological staining of mCherry+ and eGFP+;mCherry+ cells isolated from hearts at 4 dpi. Shown are representative examples of 9/10 and 6/8 analyzed cells, for double- and single-positive cells, respectively. Two experimental replicates are shown.
(K) Area measurements of sorted cells from (J) and (J’). Means ± SDs are shown. Calculations were done using Welch’s t test. The black points represent statistically significant outliers, by the Grubbs test (α = 0.05), excluded from statistical analysis.
(L) qRT-PCR for wt1b in mCherry+ and eGFP+;mCherry+ cells isolated from cryoinjured hearts. The points represent biological replicates. Means ± SDs are shown; two-tailed unpaired t test. Ten experimental replicates are shown.
Scale bars, 100 μm (B, D, and F), 10 μm (C, E, G, J, and J’), and 5 μm (magnified views in C’–G’’’). at, atrium; ba, bulbus arteriosus; dpi, days post-injury; FACS, fluorescence-activated cell sorting; v, ventricle.