
Image
|
Figure Caption
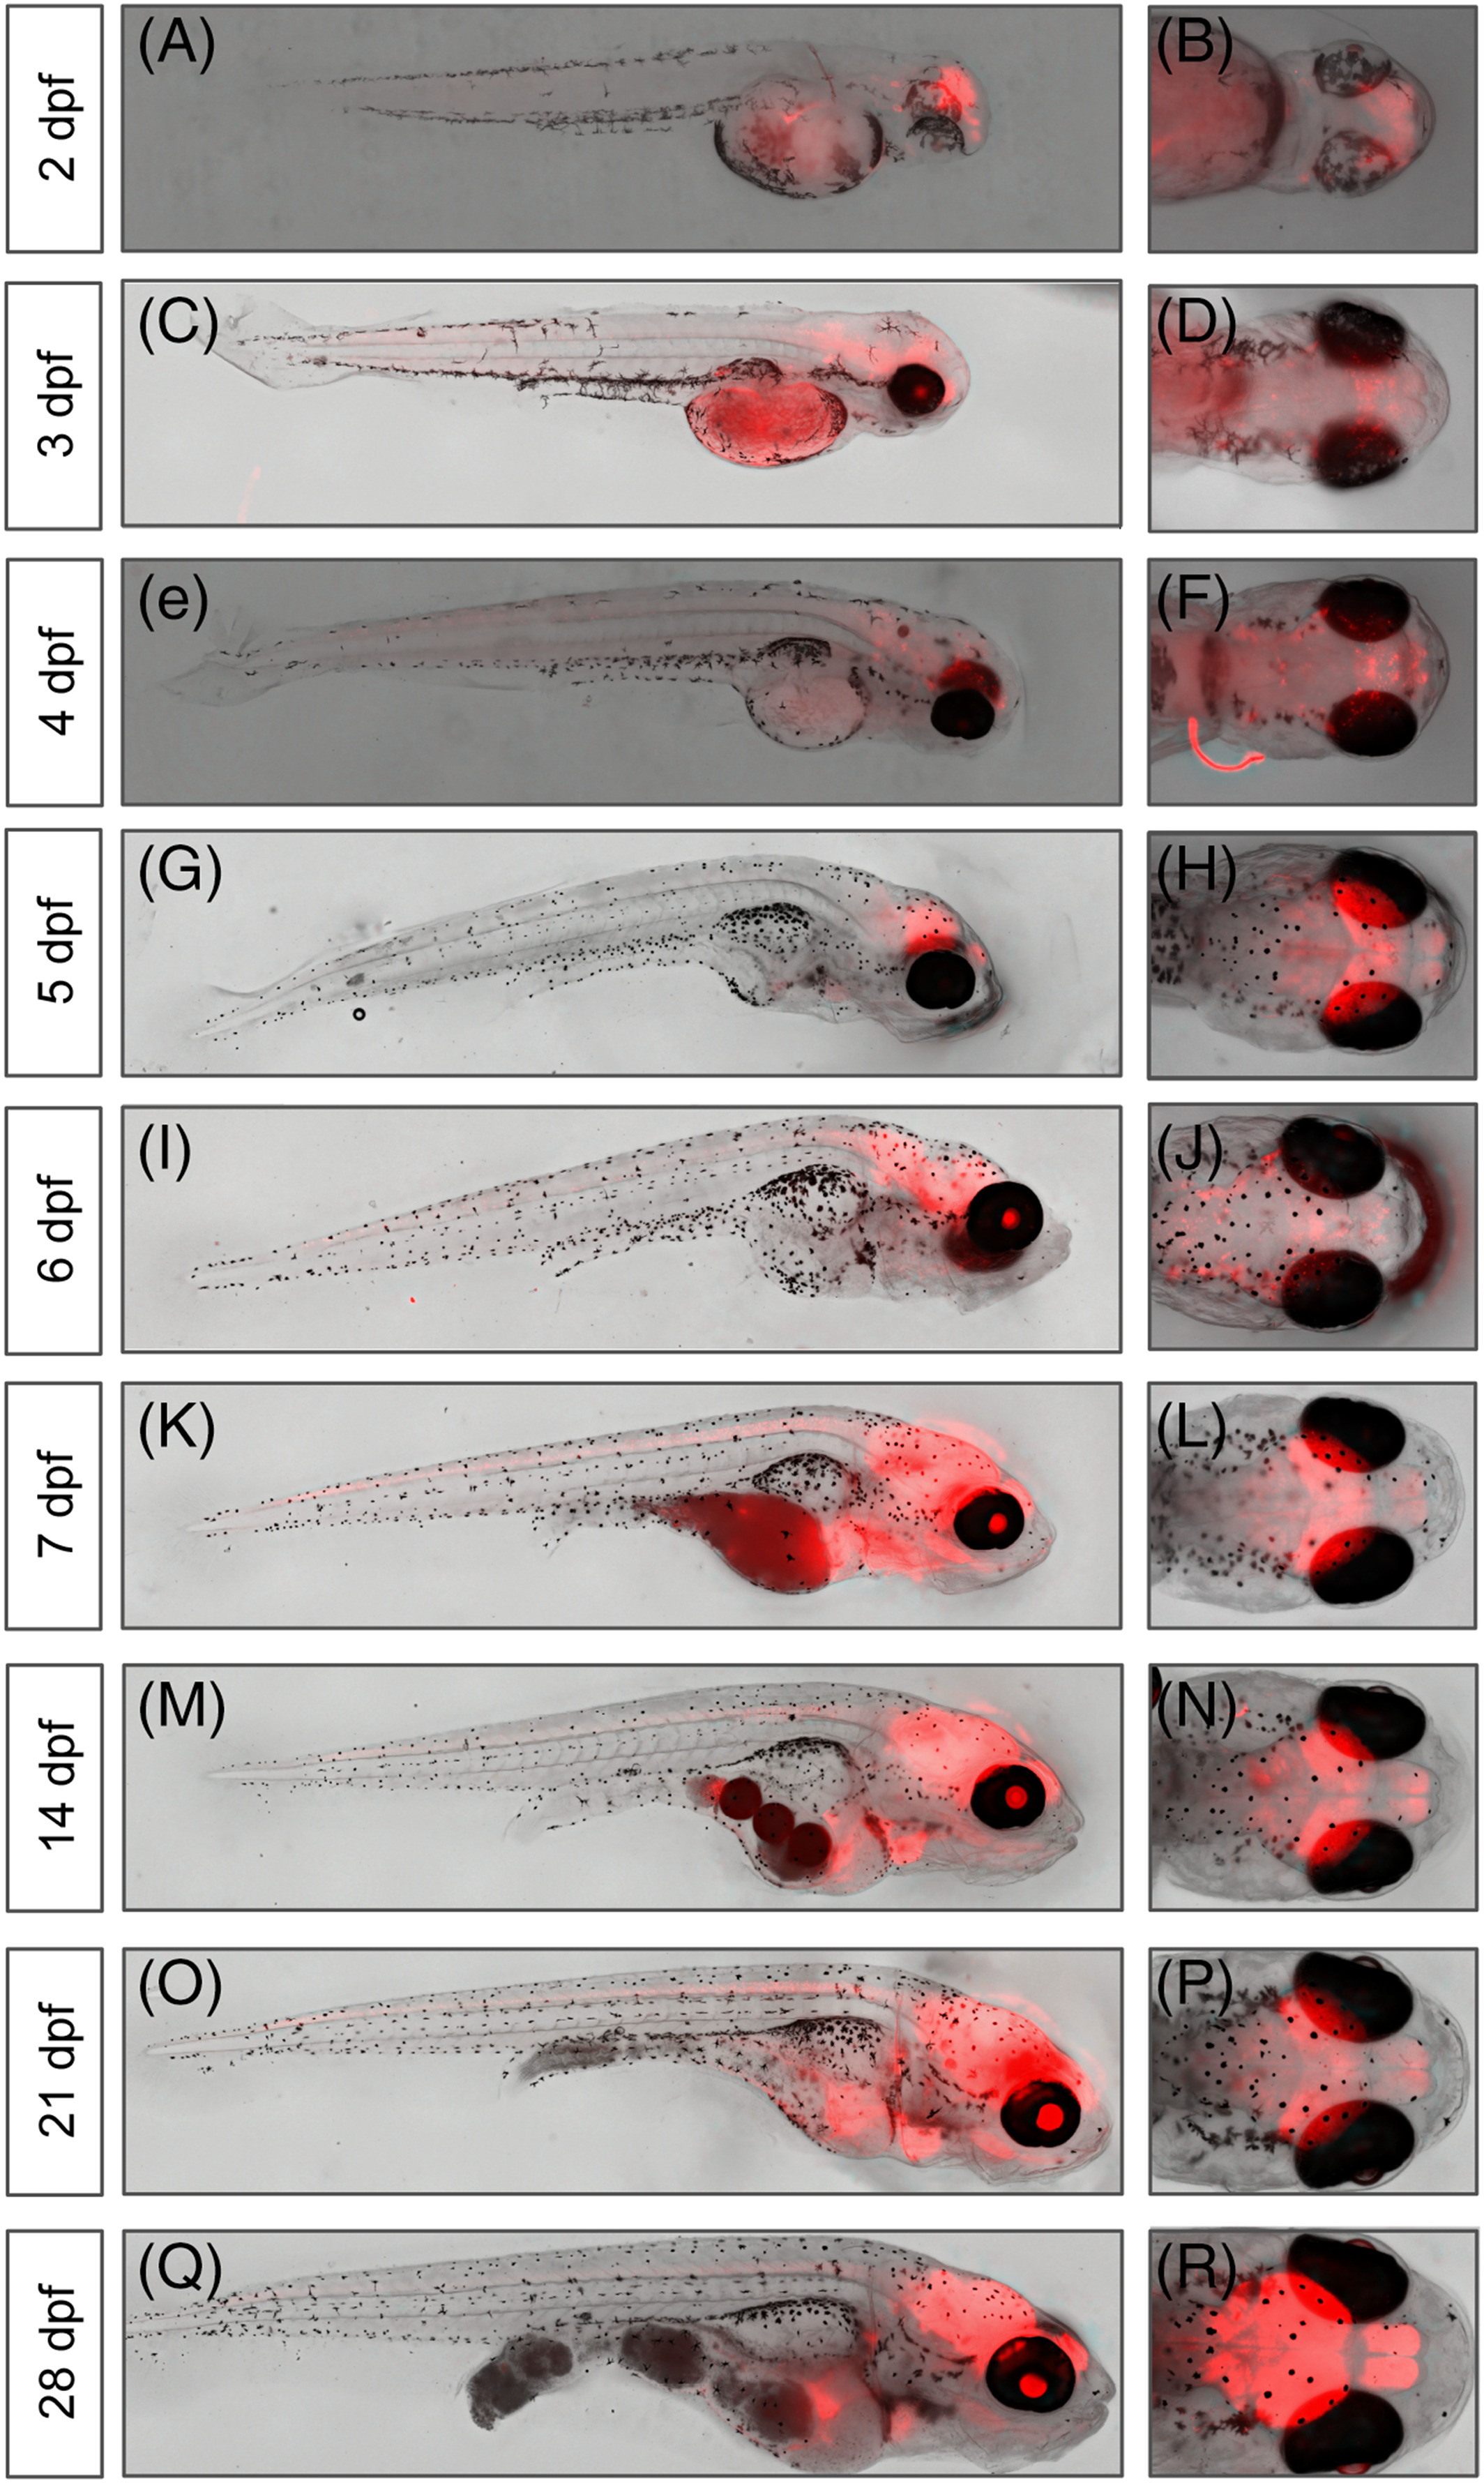
Fig. 3
A‐R, Expression of Cntnap2a‐mCherry across development. Visualization of Cntnap2a‐mCherry expression during early development (2‐28 dpf) in whole body (left column) and dorsal head view (right column). Cntnap2a expression is evident throughout the lateral line and hindbrain regions
Acknowledgments
This image is the copyrighted work of the attributed author or publisher, and
ZFIN has permission only to display this image to its users.
Additional permissions should be obtained from the applicable author or publisher of the image.
Full text @ Dev. Dyn.