
|
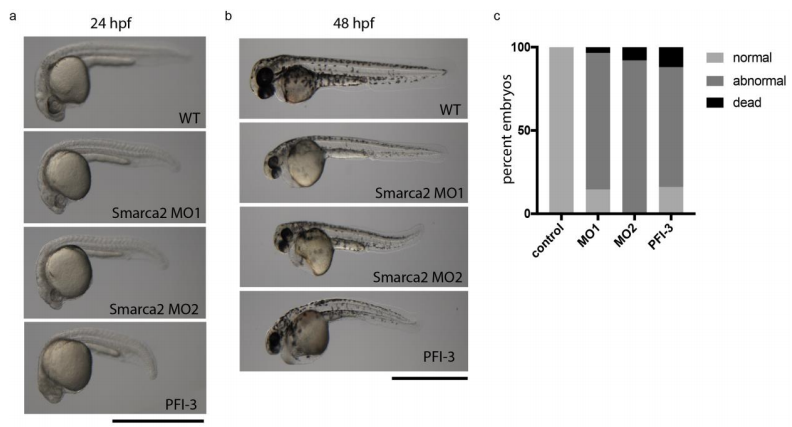
Fig. S6
Abnormal development following Smarca2 depletion or inhibition (a) Bright field images of 24 hpf zebrafish larvae following injection with 2 ng of morpholinos targeting Smarca2 (MO1 or MO2) or 100 M PFI-3 at the 1 cell stage. Scale bars represent 1 mm. (b) Bright field images of 48 hpf zebrafish larvae following injection with 2 ng of morpholinos targeting Smarca2 (MO1 or MO2) or 100 M PFI-3 at the 1 cell stage. Scale bars represent 1 mm. (c) Quantification of embryos that were normal, dead or showed anomalies consistent with panel a, at 24 hpf. A minimum of 70 embryos were scored per condition. Numbers are representative of three independent experiments.