
|
Fig. S2
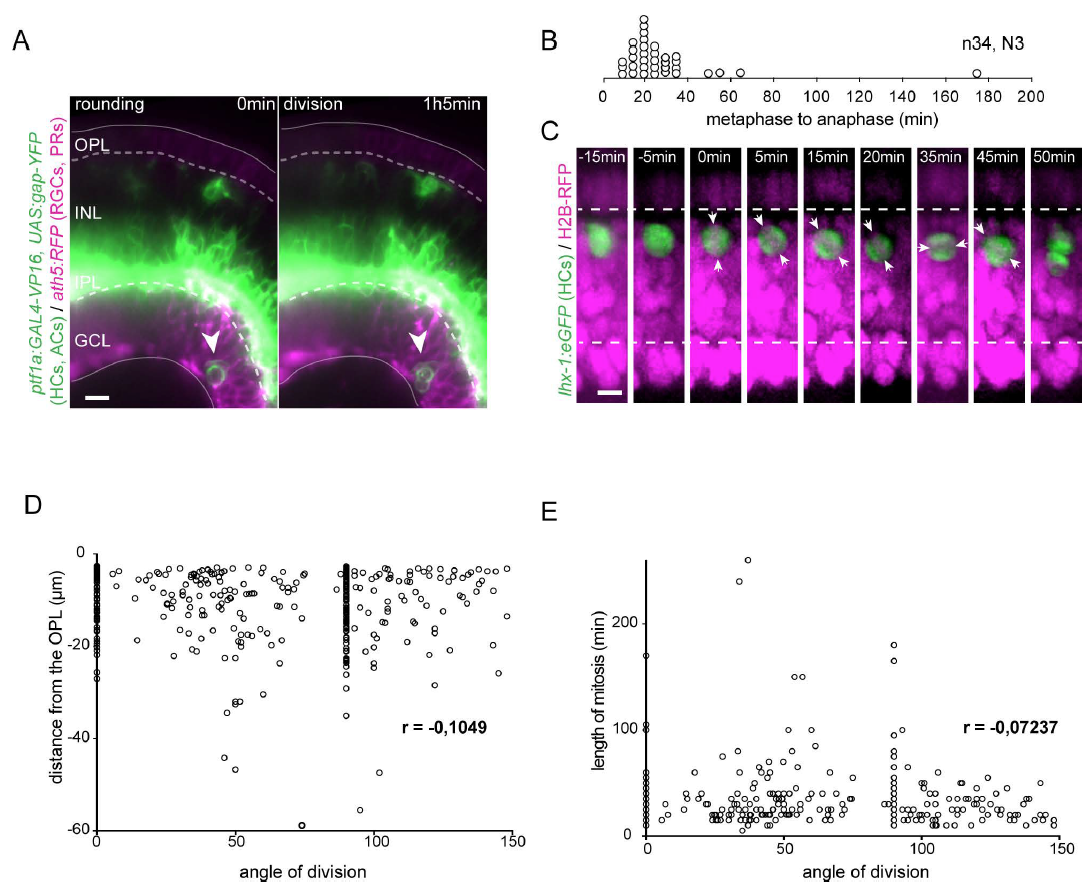
Heterogeneity in mitotic position and behaviour of committed HCpr subtypes. (A) Rare example of HCpr dividing in the RGC layer. ptf1a:GAL4-VP16, UAS:gap-YFP (green, HCpr and AC); ath5:RFP (PR and RGC). White arrow: mitotic HCpr. White dashed line: OPL (top), IPL (bottom). Scale Bar, 10 μm. (B) Spread of metaphase to anaphase duration in mitotic HCprs. (C) Example of HCpr spindle rocking before mitosis. lhx-1:eGFP (HCpr, green); H2Bmcherry (nuclei, magenta), white arrows: position of metaphase plate. White dashed line: the OPL (top), the IPL (bottom). Scale Bar, 5 μm. (D) Distribution of HCpr mitotic angle versus position does not show a strong correlation. (E) Distribution of HCpr angle versus length of mitosis does not show a strong correlation.