
|
Fig. S1
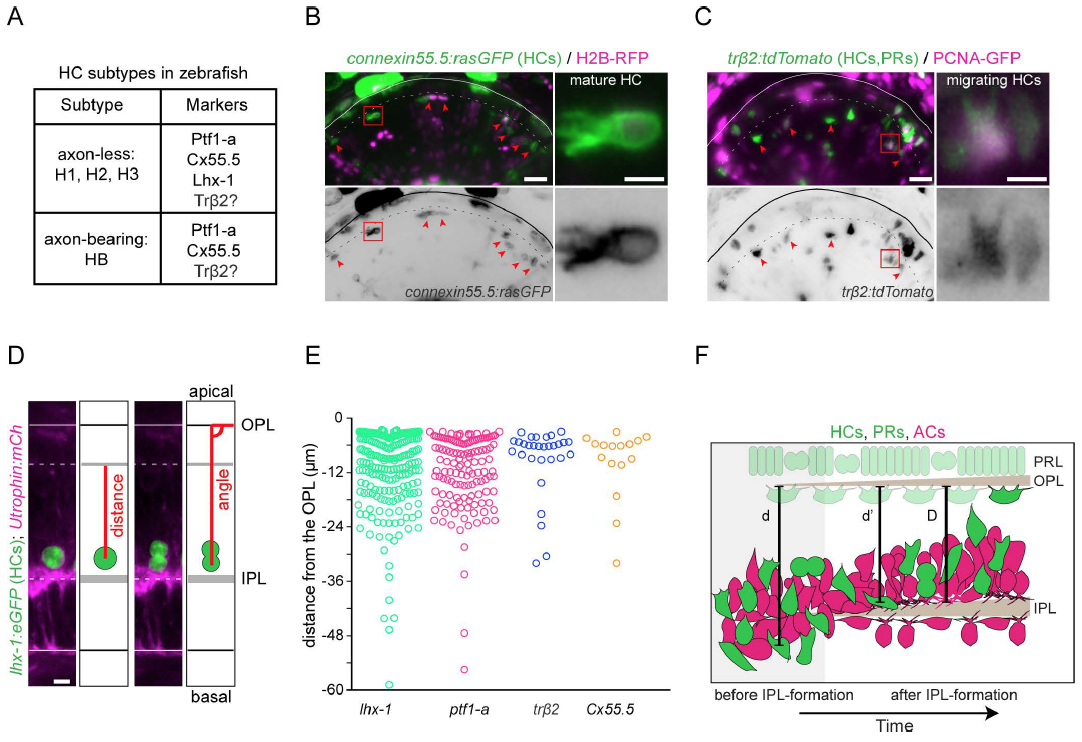
(A) HCs subtypes and markers in the zebrafish retina. B-C) Typical examples of HCprs labelled with (B) Connexin55.5:rasGFP (Cx55.5) and (C) Trb2:tdTomato. Red arrowheads point to HCs within the HC layer. Dashed line represents the OPL. Scale bar 10μm. Insets of the red-boxed region shows magnified HC. Scale bar 5μm. (D) Schematic showing measurement of HC distance from the OPL at rounding (left) (analyzed data can be found in Figure 1E and divided by marker the same data is seen in Supplementary Figure 1E) and HC angle of division (right) (analyzed data can be found in Figure 1G). Scale Bar, 5 μm. (E) Position of mitotic HCprs for different HC marker populations. (The pooled version of this analysis can be found in Figure 1E this is the same data divided by marker) (F) Schematic showing depth of migration measurements. Relative thickness of the INL was quantified by drawing a line (D) from the OPL to the IPL using Fiji Line tool. To quantify HC position, a line (d’) was drawn from the center of HC to the OPL. Relative percentage of HC depth was defined by dividing d’/D. For earlier developmental stages before the IPL formation, thickness of the INL was measured once the IPL was formed within the same region (analyzed data can be found in Figure 3 F and G).