
|
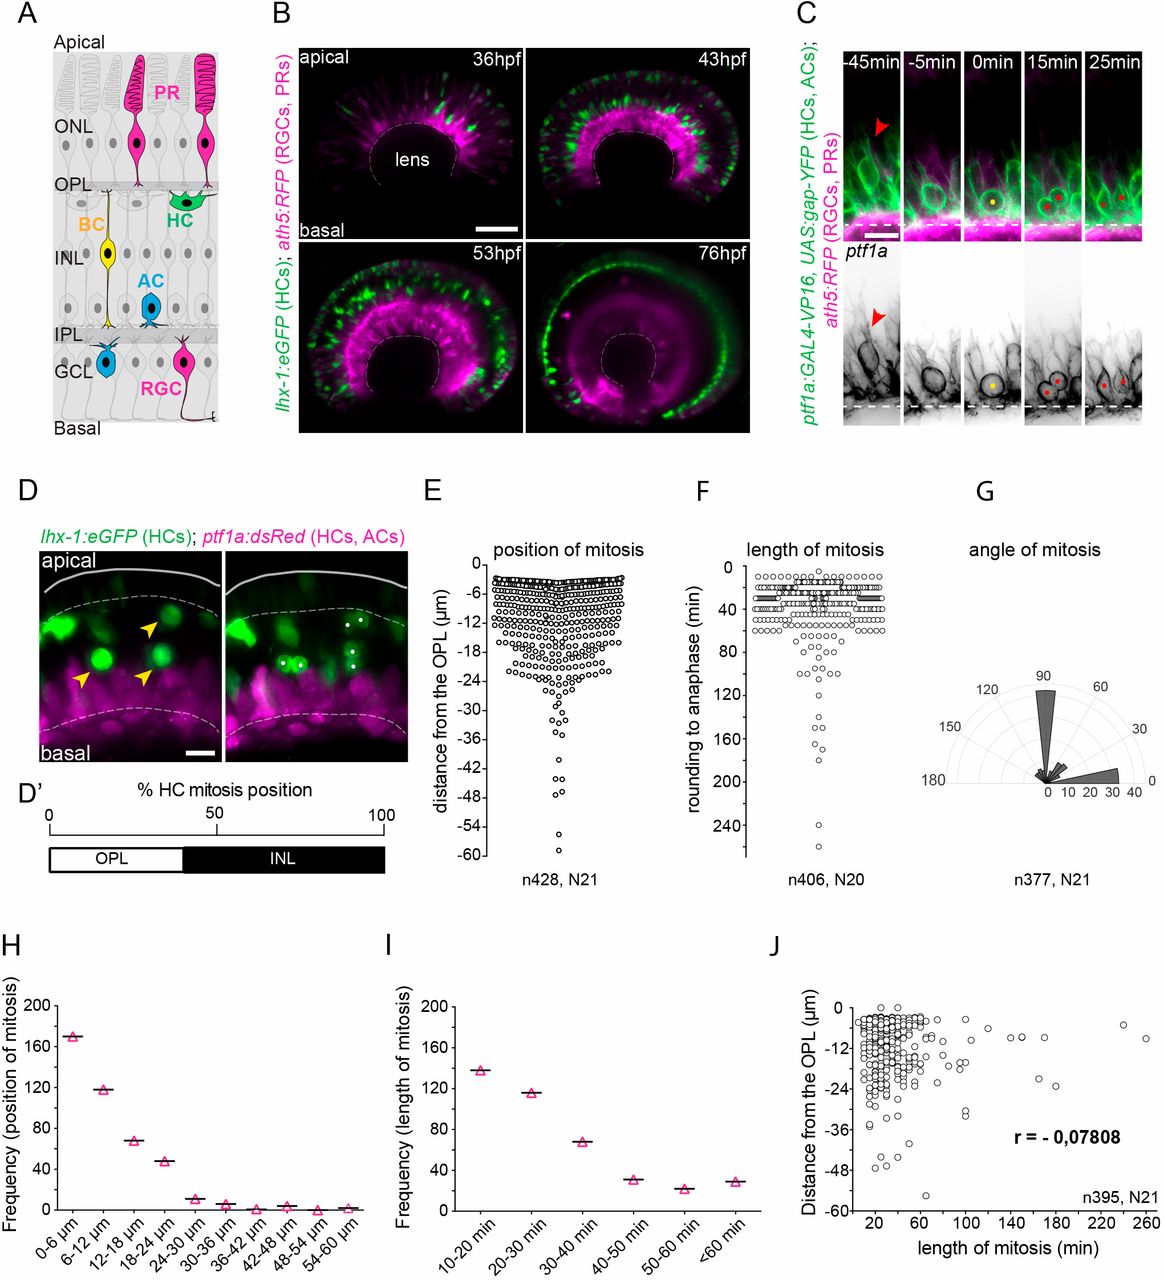
Fig. 1
Heterogeneity in mitotic position and behaviour of HCprs. (A) Scheme of zebrafish retina. Neurons: photoreceptors (PRs, magenta); horizontal cells (HCs, green); bipolar cells (BCs, yellow); amacrine cells (ACs, blue) and retinal ganglion cells (RGCs, magenta). Layers: outer nuclear layer (ONL), inner nuclear layer (INL), ganglion cell layer (GCL), outer plexiform layer (OPL) and inner plexiform layer (IPL). (B) Montage of HC lamination 36 hpf-76 hpf. lhx-1:eGFP(HC and PR, green), ptf1a:dsRed (AC and HC, magenta). Scale bar: 10 µm. (C) Montage representing a typical example of HCpr mitosis length. Time is relative to mitosis onset. Red arrowhead indicates pre-mitotic protrusive cell; yellow dot indicates mitotic cell; red dots indicates sister cells after division; and dotted white line indicates IPL. Scale bar: 5 µm. (D) Position and angle of HCpr mitosis is heterogenous. Yellow arrowheads indicate mitotic HCprs; white dots indicate sister HCs after division; white dotted line indicates OPL (top) and IPL (bottom). Scale bar: 10 µm. (D′) Percentage distribution of HCpr position of division. (E) Position (µm), (F) duration (min) and (G) angle of HCpr mitosis. (H,I) Frequency of mitotic (H) position and (I) duration. (J) Plot of mitotic duration versus position shows no strong correlation. Regression analysis was carried out using Pearson's correlation (r).