
|
Fig. 2
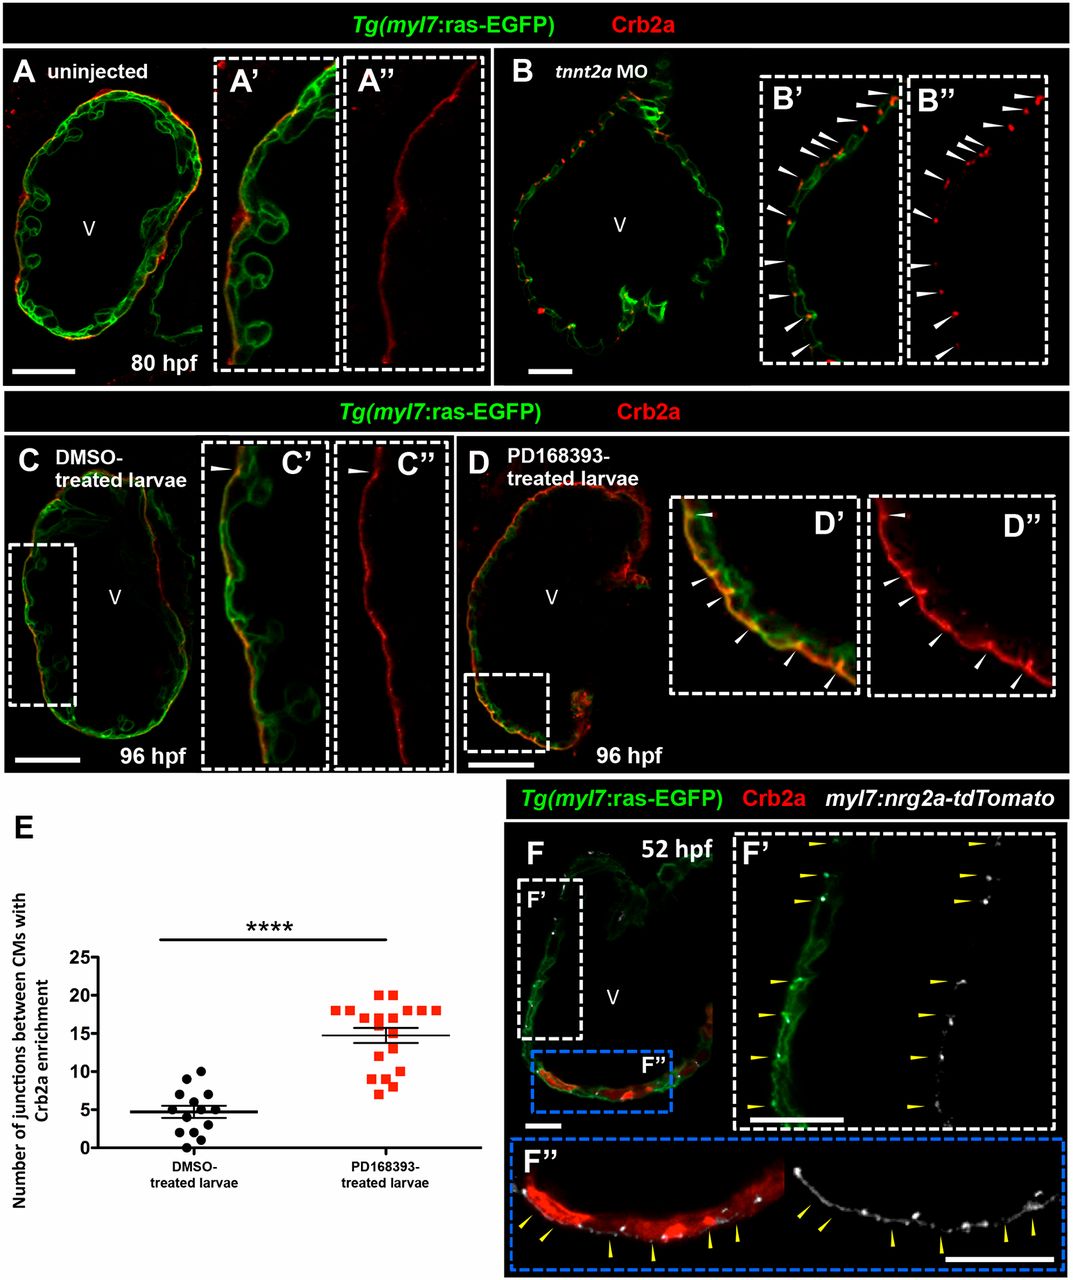
Crb2a localization in developing CMs is modulated by blood flow and Nrg2a/ErbB2 signaling. (A-B″) Crb2a immunostaining in Tg(myl7:ras-EGFP) control (A, n=8) and tnnt2a morphant (B, n=8) hearts at 80 hpf. Higher-magnification images show apical localization of Crb2a in control (A′,A″) and tnnt2a morphant hearts (B′,B″); arrowheads indicate junctional localization of Crb2a between CMs. (C-D″) Crb2a immunostaining in 96 hpf Tg(myl7:ras-EGFP) hearts treated between 54 and 96 hpf with DMSO (C-C″, n=14) or PD168393 (D-D″, n=19); arrowheads indicate Crb2a enrichment at the junctions between CMs. (E) Number of junctions between CMs with Crb2a enrichment. Each dot or square represents data from one heart. Data are mean±s.e.m. ****P<0.0001 by Student's t-test. (F) Crb2a immunostaining in 52 hpf Tg(myl7:ras-EGFP) embryos injected at the one-cell stage with a myocardial-specific nrg2a construct (myl7:nrg2a-p2a-tdTomato) (n=8). (F′,F″) Higher-magnification images show junctional localization of Crb2a in non-nrg2a-expressing CMs (arrowheads in white dashed box, F′) and apical Crb2a localization in nrg2a-expressing CMs (arrowheads in blue dashed box, F″). V, ventricle