IMAGE

Figure 4

ID
ZDB-IMAGE-190723-476
Source
Figures for Dohaku et al., 2019
Image
Figure Caption

Figure 4

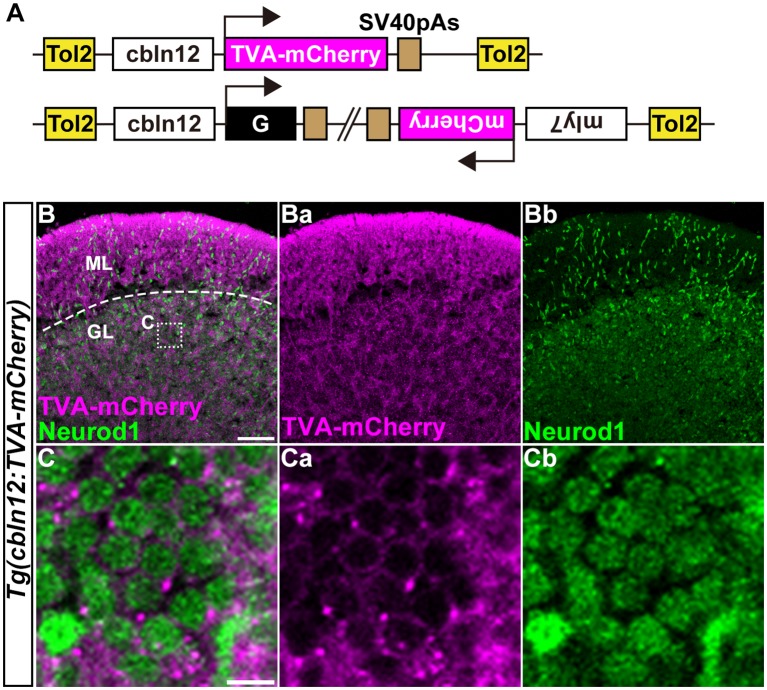
Transgenic lines for tracing GC afferents. (A) Schematic drawing of the Tol2 plasmids used to express TVA-mCherry or RVG. The cbln12 promoter was used to express transgenes in GCs. pBH was used to identify G-expressing fish. (B,C) Immunostaining of sagittal sections of the adult Tg(cbln12:TVA-mCherry) cerebellum with anti-mCherry (magenta) and anti-Neurod1 (green) antibodies. (C) High-magnification images of the box in (B). TVA-mCherry (Ba,Ca), Neurod1 (Bb,Cb), and merged images (B,C) are shown. Note that TVA-mCherry was located on the cell membrane of Neurod1+ GCs (C). Scale bars: (B) 50 μm, and (C) 5 μm.

Figure Data
Acknowledgments
This image is the copyrighted work of the attributed author or publisher, and ZFIN has permission only to display this image to its users. Additional permissions should be obtained from the applicable author or publisher of the image. Full text @ Front. Neural Circuits