IMAGE

Fig 6

ID
ZDB-IMAGE-190723-321
Genes
Source
Figures for Blümel et al., 2019
Image
Figure Caption

Fig 6 <italic>In vivo</italic> studies of evolutionarily conserved non-coding elements (CNEs) near the <italic>tcf12</italic> locus identified two enhancer elements that drive specific neuronal expression.

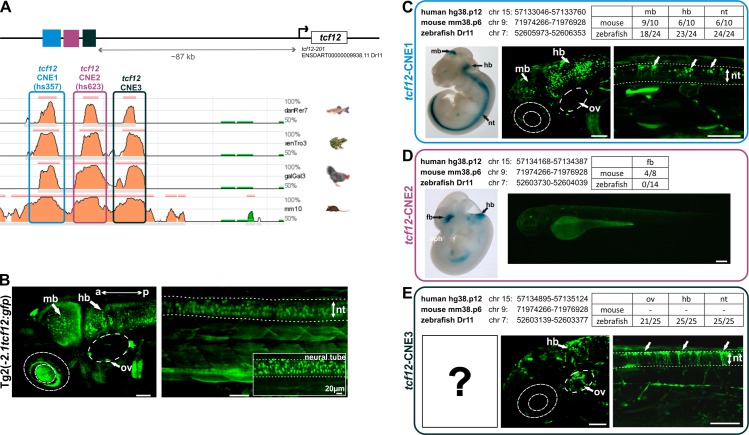
(A) Graphic representation of the location of tcf12-CNE1-3 located ~87 kb 5’ of the tcf12 gene (transcript tcf12-201 ENSDART00000009938.11) and interspecies alignments using the ECR browser [39]. (B) Fluorescent images of head and trunk of the Tg(-2.1tcf12:EGFP) line. (C to E) Comparison of the expression pattern of whole-mount lacZ staining of transgenic mice embryos from the VISTA Enhancer Browser [22] with fluorescent images of transient transgenic zebrafish embryos expressing tcf12-CNE1, tcf12-CNE2 or tcf12-CNE3. Genomic locations of the CNEs in human, mouse, and zebrafish are indicated. The table summarizes the number of mice and fish analyzed with the number of different expression pattern detected. Dotted lines mark the boundaries of the neural tube. a, anterior; hb hindbrain; mb, midbrain; nt, neural tube; ov, otic vesicle; p, poserior. All scale bars represent 50 μm unless otherwise stated.

Figure Data
Acknowledgments
This image is the copyrighted work of the attributed author or publisher, and ZFIN has permission only to display this image to its users. Additional permissions should be obtained from the applicable author or publisher of the image. Full text @ PLoS One