IMAGE

Fig 2

ID
ZDB-IMAGE-190723-316
Genes
Source
Figures for Blümel et al., 2019
Image
Figure Caption

Fig 2 Comparison of EGFP expression in <italic>Tg(-0</italic>.<italic>2tcf12</italic>:<italic>EGFP)</italic> and <italic>Tg(-2</italic>.<italic>1tcf12</italic>:<italic>EGFP)</italic> fish.

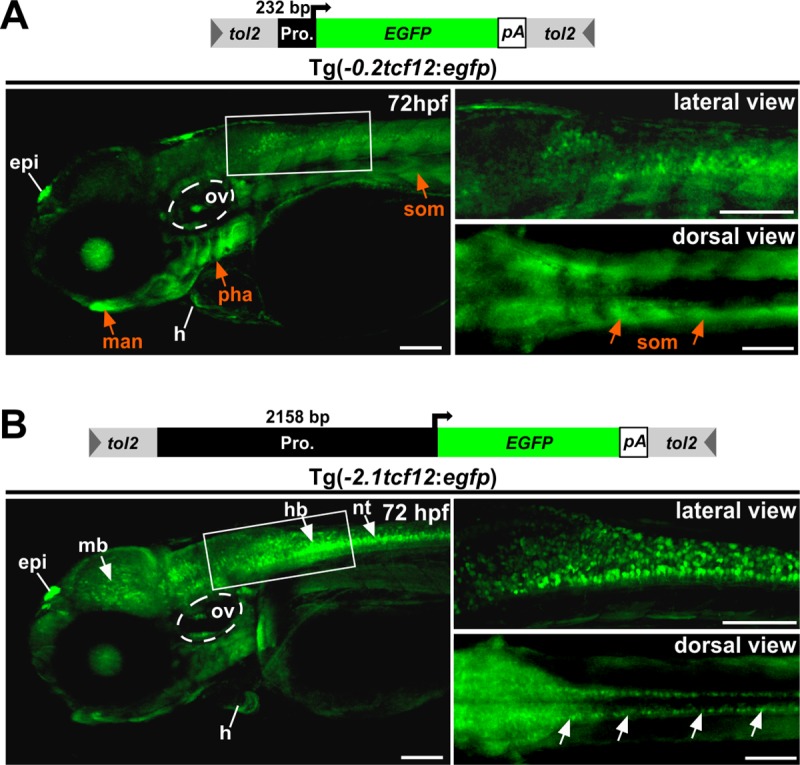
Comparison between different tcf12:EGFP transgenic lines. (A) The minimal promoter driven Tg(-0.2tcf12:EGFP) individuals show strong EGFP expressions in the gills (Pharyngeal arches), the lower jaw (mandible) and the somites (orange arrows). These expression domains are absent or rather weak in Tg(-2.1tcf12:EGFP) fish (B). Tg(-2.1tcf12:EGFP) zebrafish show a strong EGFP signal in neurons of the mid- and hindbrain and the neural tube (white arrows in B), which are lacking in the Tg(-0.2tcf12:EGFP) animals. An EGFP expression in the heart, the otic vesicle, and the epiphysis is detectable in both transgenic lines. epi, epiphysis; h, heart; hb, hindbrain; hpf, hours post fertilization; man, mandible; mb, midbrain; nt, neural tube; ov, otic vesicle; pha, pharyngeal arches; som, somites. All scale bars represent 100 μm unless otherwise stated.

Figure Data
Acknowledgments
This image is the copyrighted work of the attributed author or publisher, and ZFIN has permission only to display this image to its users. Additional permissions should be obtained from the applicable author or publisher of the image. Full text @ PLoS One