
Image
|
Figure Caption
Figure 1
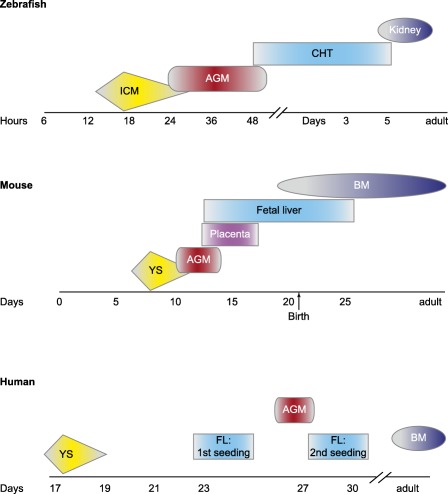
Comparison of timing of hematopoietic development across vertebrates. Time lines showing when and where primitive and definitive hematopoietic induction occurs in zebrafish (top), mice (middle), and humans (bottom). Abbreviations: AGM, aorta‐gonad‐mesonephros; BM, bone marrow; CHT, caudal hematopoietic tissue; FL, fetal liver; ICM, intermediate cell mass; YS, yolk sac.
Acknowledgments
This image is the copyrighted work of the attributed author or publisher, and
ZFIN has permission only to display this image to its users.
Additional permissions should be obtained from the applicable author or publisher of the image.
Full text @ Stem Cells Transl. Med.