
Image
|
Figure Caption
Fig 4
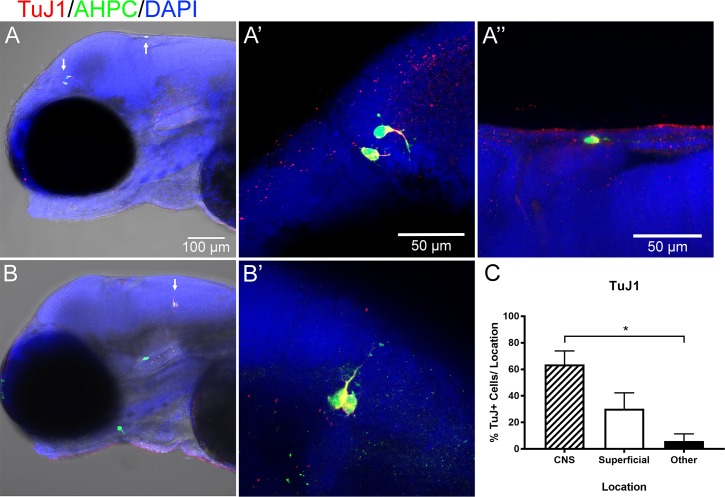
A significant proportion of superficially-located cells were also neuronal, as indicated by TuJ1 immunolabeling (red) at 3 dpf. Arrows indicate cells selected for higher magnification. A) TuJ1+ cells were in the brain and at a superficial region. B) TuJ1+ cells in the brain and TuJ1- cells in facial cartilage. C) Quantification of the percent of TuJ1+ cells/location for each larvae at 3 dpf. One-way ANOVA with Dunn’s multiple comparisons test. N = 5. Error bars indicate standard error of the mean.
Acknowledgments
This image is the copyrighted work of the attributed author or publisher, and
ZFIN has permission only to display this image to its users.
Additional permissions should be obtained from the applicable author or publisher of the image.
Full text @ PLoS One