IMAGE

Figure 2

ID
ZDB-IMAGE-190723-173
Source
Figures for Emfinger et al., 2019
Image
Figure Caption

Figure 2

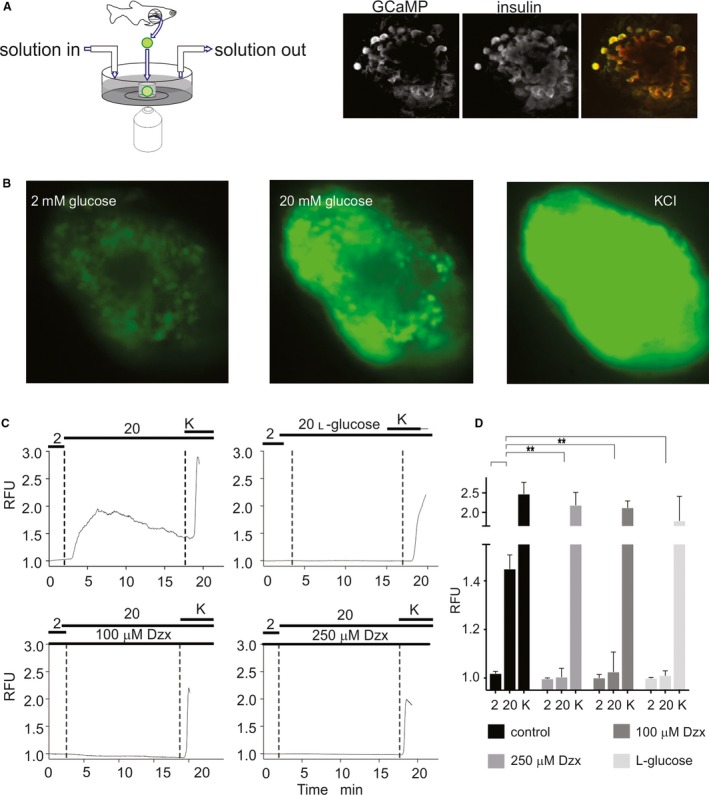
Intracellular [Ca2+] in adult islets is glucose‐sensitive. (A, left) Islets were imaged in microchambers (~4 μL) cored out of agar, on the bottom of a petri dish. Flow of bulk solution into and out of the dish (~1 mL) was controlled as indicated. (right) GCaMP fluorescence and anti‐insulin staining in representative islet, together with overlay (GCamp fluorescence green, anti‐insulin red). (B) Individual frames of islets at low (2 mmol/L) and high (20 mmol/L) glucose (middle), and in 20 mmol/L glucose plus 30 mmol/L KCl (right). (C) Representative fluorescence traces from individual islets, normalized to initial fluorescence (relative fluorescence units, RFU), during transitions from low glucose to 20 mmol/L d‐ or l‐glucose, and 20 mmol/L glucose plus 30 mmol/L KCl, in absence or presence of diazoxide, as indicated. (D) Summary of calcium responses to high 2 or 20 mmol/L d‐ or l‐glucose, or 20 glucose plus 30 mmol/L KCl, in absence or presence of diazoxide, as indicated from experiments as in C (N = 6–10 in each case). (**) P < 0.05.

Acknowledgments
This image is the copyrighted work of the attributed author or publisher, and ZFIN has permission only to display this image to its users. Additional permissions should be obtained from the applicable author or publisher of the image. Full text @ Physiol. Rep.