IMAGE

Figure 5

ID
ZDB-IMAGE-190723-1662
Source
Figures for Nguyen et al., 2016
Image
Figure Caption

Figure 5

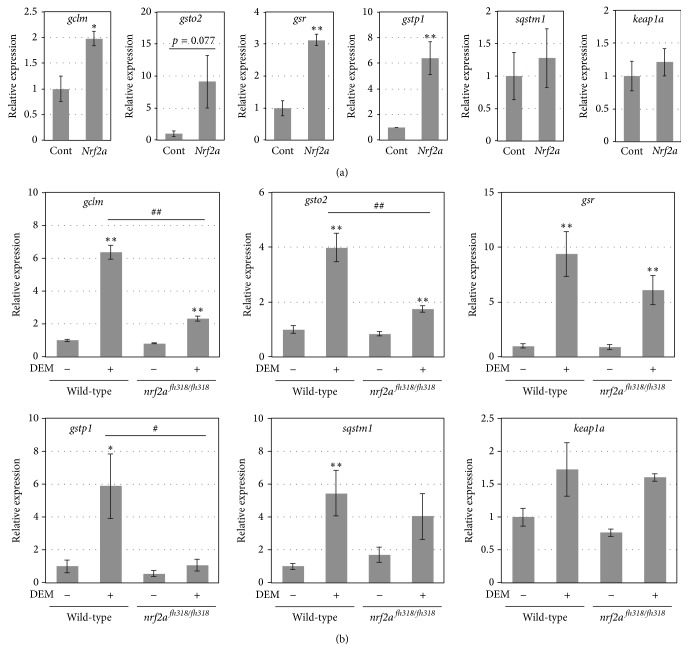
The expression of other candidate genes for zebrafish Nrf2 targets. (a) The expression of the indicated genes in 8 hpf wild-type embryos injected with or without 100 pg of nrf2a mRNA at the 1-cell stage was analyzed by a real-time qPCR. Asterisks denote statistical significance (Control versus nrf2a overexpression, P < 0.05 and ∗∗P < 0.01; Student's t-test, n = 6 for each group). (b) The expression of the indicated genes in 4 dpf wild-type or nrf2afh318/fh318 mutant larvae treated with or without 100 μM DEM for 6 h was analyzed by a real-time qPCR. Asterisks and hash marks denote statistical significance (DEM+ versus DEM−, P < 0.05 and ∗∗P < 0.01; wild-type versus nrf2afh318/fh318, #P < 0.05 and ##P < 0.01; Student's t-test, n = 6 for each group).

Acknowledgments
This image is the copyrighted work of the attributed author or publisher, and ZFIN has permission only to display this image to its users. Additional permissions should be obtained from the applicable author or publisher of the image. Full text @ Oxid Med Cell Longev