IMAGE

Figure 3

ID
ZDB-IMAGE-190723-1659
Source
Figures for Nguyen et al., 2016
Image
Figure Caption

Figure 3

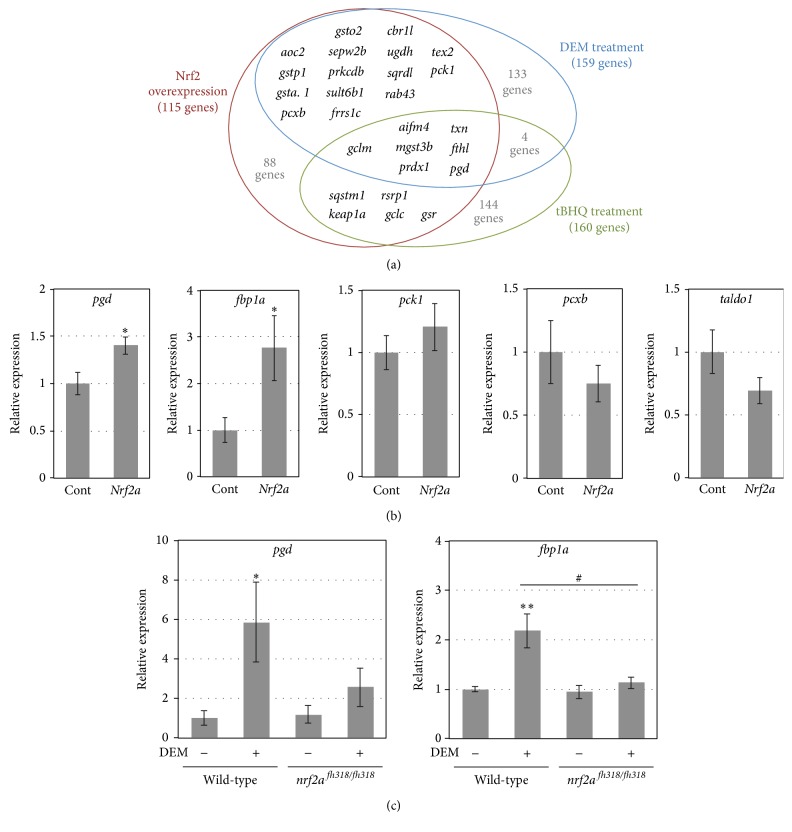
The expression of glucose metabolism-related genes. (a) The upregulated gene lineups from the three microarray experiments were compared. The data of DEM- or tBHQ-treated zebrafish larvae are from Nakajima et al. [19] and Hahn et al. [20], respectively. Numbers in parentheses and in the Venn diagrams denote the numbers of genes which belong to each category. The names of 27 overlapping genes were displayed. (b) The gene expression of the indicated enzymes related to glucose metabolism in 8 hpf wild-type embryos injected with or without 100 pg of nrf2a mRNA at the 1-cell stage was analyzed by a real-time qPCR. Asterisks denote statistical significance (Control versus nrf2a overexpression, P < 0.05; Student's t-test, n = 6 for each group). (c) The gene expression of the indicated enzymes related to glucose metabolism in 4 dpf wild-type or nrf2afh318/fh318 mutant larvae treated with or without 100 μM DEM for 6 h was analyzed by a real-time qPCR. Asterisks and hash marks denote statistical significance (DEM+ versus DEM−, P < 0.05 and ∗∗P < 0.01; wild-type versus nrf2afh318/fh318, #P < 0.05; Student's t-test, n = 6 for each group).

Acknowledgments
This image is the copyrighted work of the attributed author or publisher, and ZFIN has permission only to display this image to its users. Additional permissions should be obtained from the applicable author or publisher of the image. Full text @ Oxid Med Cell Longev