IMAGE

Figure 1

ID
ZDB-IMAGE-190723-1657
Source
Figures for Nguyen et al., 2016
Image
Figure Caption

Figure 1

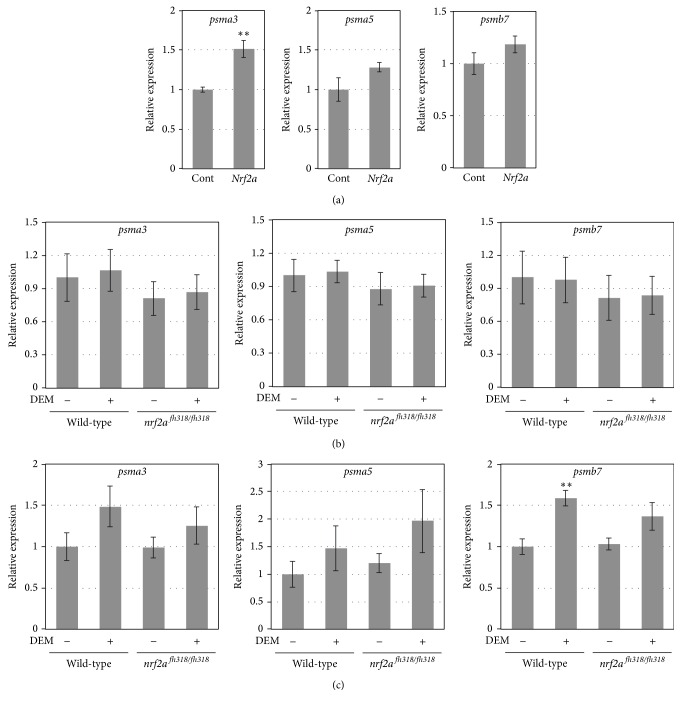
The expression of the proteasome subunit genes. (a) The gene expression of the indicated proteasome subunits in 8 h postfertilization (hpf) wild-type embryos injected with or without 100 pg of nrf2a mRNA at the 1-cell stage was analyzed by a real-time qPCR. Total RNA was extracted from 30 embryos for each sample. The expression of each gene was normalized to that of ef1α (means ± SEM), and the value in uninjected control was set to 1. Asterisks denote statistical significance (Control versus nrf2a overexpression, ∗∗P < 0.01; Student's t-test, n = 6 for each group). (b) and (c) The gene expression of the indicated proteasome subunits in 4 dpf wild-type or nrf2afh318/fh318 mutant larvae that were treated (or not treated) with 100 μM DEM for 6 h (b) and 12 h (c) was analyzed by a real-time qPCR. The expression of each gene was normalized to that of ef1α (means ± SEM), and the value in untreated wild-type control was set to 1.

Acknowledgments
This image is the copyrighted work of the attributed author or publisher, and ZFIN has permission only to display this image to its users. Additional permissions should be obtained from the applicable author or publisher of the image. Full text @ Oxid Med Cell Longev