IMAGE

Fig. 3

ID
ZDB-IMAGE-190723-1649
Source
Figures for Arjona et al., 2018
Image
Figure Caption

Fig. 3

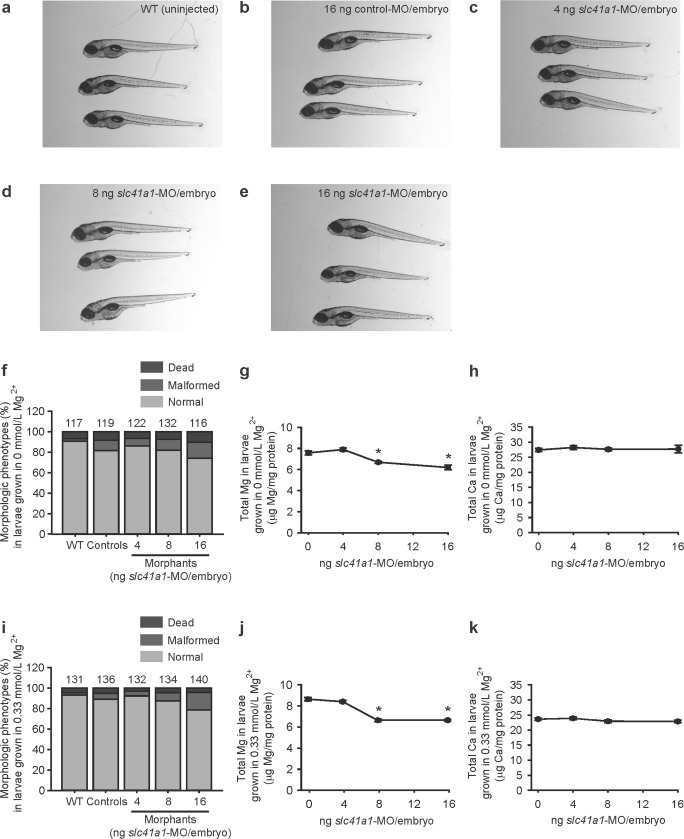
Slc41a1 knockdown evokes renal Mg2+ wasting in zebrafish. ae Representative images of the normal morphologic phenotypes obtained in untreated (WT) 120 hpf zebrafish grown in Mg2+-free E3 medium and after injection of 16 ng control-MO/embryo or 4–16 ng slc41a1-MO/embryo (splice-site blocking MO). f Distribution of morphologic phenotypes in zebrafish larvae (120 hpf) untreated (WT) or after injection with different doses of slc41a1-MO (splice-site blocking MO) or control-MO. Fish were grown in Mg2+-free E3 medium. Numbers on top of the bars indicate the number of animals in each experimental condition. g, h Total Mg (g) and Ca (h) content in morphologically normal 120 hpf zebrafish grown in Mg2+-free E3 medium after injection with different doses of slc41a1-MO (splice-site blocking MO); the dose of zero represents injection with 16 ng control-MO/embryo (n = 10). i Distribution of morphologic phenotypes in zebrafish larvae (120 hpf) untreated (WT) or after injection with different doses of slc41a1-MO (splice-site blocking MO) or control-MO. Fish were grown in E3 medium (0.33 mmol/L Mg2+). Numbers on top of the bars indicate the number of animals in each experimental condition. j, k Total Mg (j) and Ca (k) content in morphologically normal 120 hpf zebrafish grown in E3 medium (0.33 mmol/L Mg2+) after injection with different doses of slc41a1-MO (splice-site blocking MO); the dose of zero represents injection with 16 ng control-MO/embryo (n = 10). g, h, j, k Data are presented as mean ± S.E.M. Asterisks indicate significant differences between control and experimental groups (*P < 0.05)

Figure Data
Acknowledgments
This image is the copyrighted work of the attributed author or publisher, and ZFIN has permission only to display this image to its users. Additional permissions should be obtained from the applicable author or publisher of the image. Full text @ Pflügers Archiv. / Eur. J. Physiol.