IMAGE

Fig. 2

ID
ZDB-IMAGE-190723-1353
Genes
Source
Figures for Liu et al., 2019
Image
Figure Caption

Fig. 2

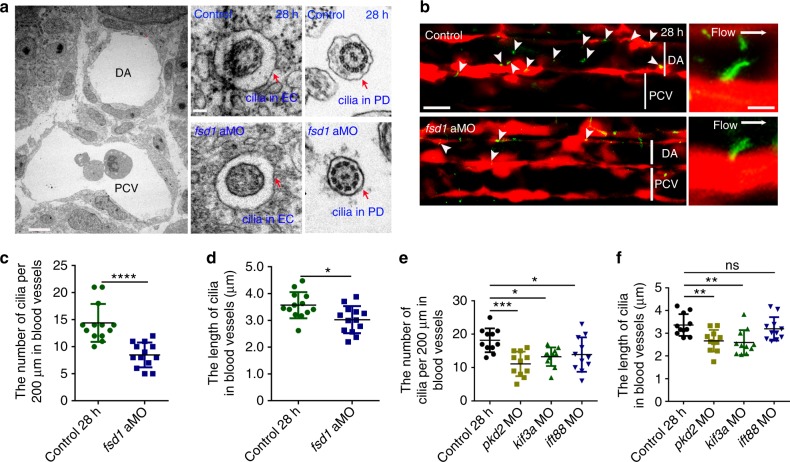
Loss of cilia genes causes primary cilia defects in blood vessels in the aorta-gonad-mesonephros (AGM) region. a Transmission electron microscopy (TEM) imaging of blood vessels (left panel) in the AGM region in control and fsd1-deficient embryos at 28 hpf. The red arrows indicate the ultrastructure of primary cilia in vascular endothelial cells (ECs) (middle panels) and motile cilia in pronephric duct (right panels). Red arrows denote cilia. Scale bars, 5 µm (left panel) and 0.1 µm (right panel). b Visualization of cilia in ECs in the AGM region using kdrl:mCherry/βact:Arl13b–GFP double-transgenic line in control and fsd1 morphants at 28 hpf. The white arrowheads indicate the primary cilia in blood vessels. White bars denote DA or PCV region. Scale bars, 20 µm (left panel) and 5 µm (right panel). cf The quantification of the primary cilia number and length with kdrl:mCherry/βact:Arl13b–GFP double-transgenic line in control and cilia-impaired embryos at 28 hpf. Data in c, d were analyzed by Student’s t-test (n = 13 embryos). Data in e, f represent the analysis results of one-way ANOVA–Dunnett test (n = 11 embryos). Error bars, mean ± s.d. ns non-significant, *P < 0.05, **P< 0.01, ***P < 0.001, ****P < 0.0001

Figure Data
Acknowledgments
This image is the copyrighted work of the attributed author or publisher, and ZFIN has permission only to display this image to its users. Additional permissions should be obtained from the applicable author or publisher of the image. Full text @ Nat. Commun.