IMAGE

Fig. 2

ID
ZDB-IMAGE-190723-1152
Source
Figures for Laue et al., 2019
Image
Figure Caption

Fig. 2

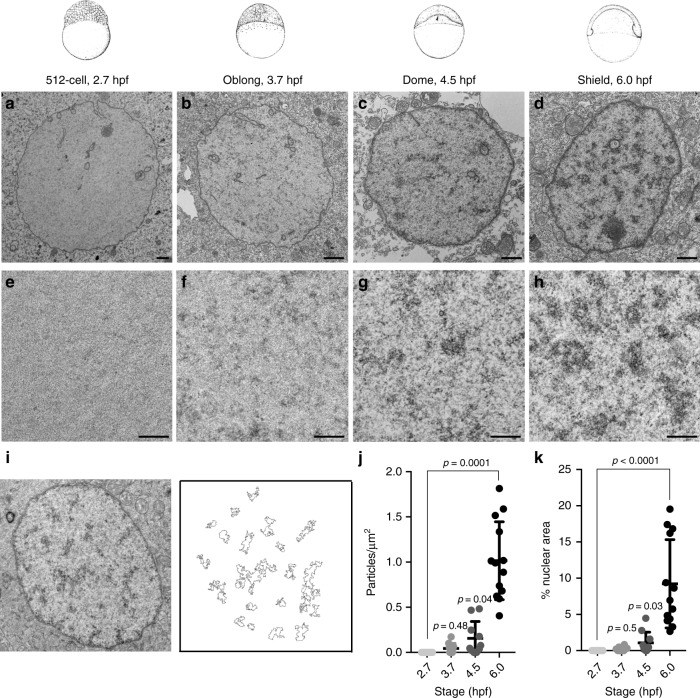
The early zebrafish embryo lacks condensed chromatin ultrastructure. Zebrafish embryonic stage schematics are reproduced from Kimmel et al.22 with permission from John Wiley & Sons Inc. ah Transmission electron micrographs (TEMs) of representative nuclei from embryos at 2.7, 3.7, 4.5, and 6 h post fertilization (hpf). Images of representative nuclei at specified time points. eh Higher magnification images (×20,000) of nuclear interior at specified time points. All scale bars (ah) indicate 1 μm. i Representative image illustrating particle selection. j Quantification of the number of particles per nuclear μm2 in TEM images at 2.7, 3.7, 4.5, and 6 hpf. k Quantification of the percent nuclear area covered by particles in TEM images at 2.7, 3.7, 4.5, and 6 hpf. Nuclei from three embryos were assessed per time point, and electron-dense aggregates were quantified in four to six representative nuclei from each embryo. Each point represents data from one nucleus. P values were calculated using the Kruskal–Wallis test and corrected for multiple comparisons, error bars indicate standard deviation (SD)

Acknowledgments
This image is the copyrighted work of the attributed author or publisher, and ZFIN has permission only to display this image to its users. Additional permissions should be obtained from the applicable author or publisher of the image. Full text @ Nat. Commun.