
|
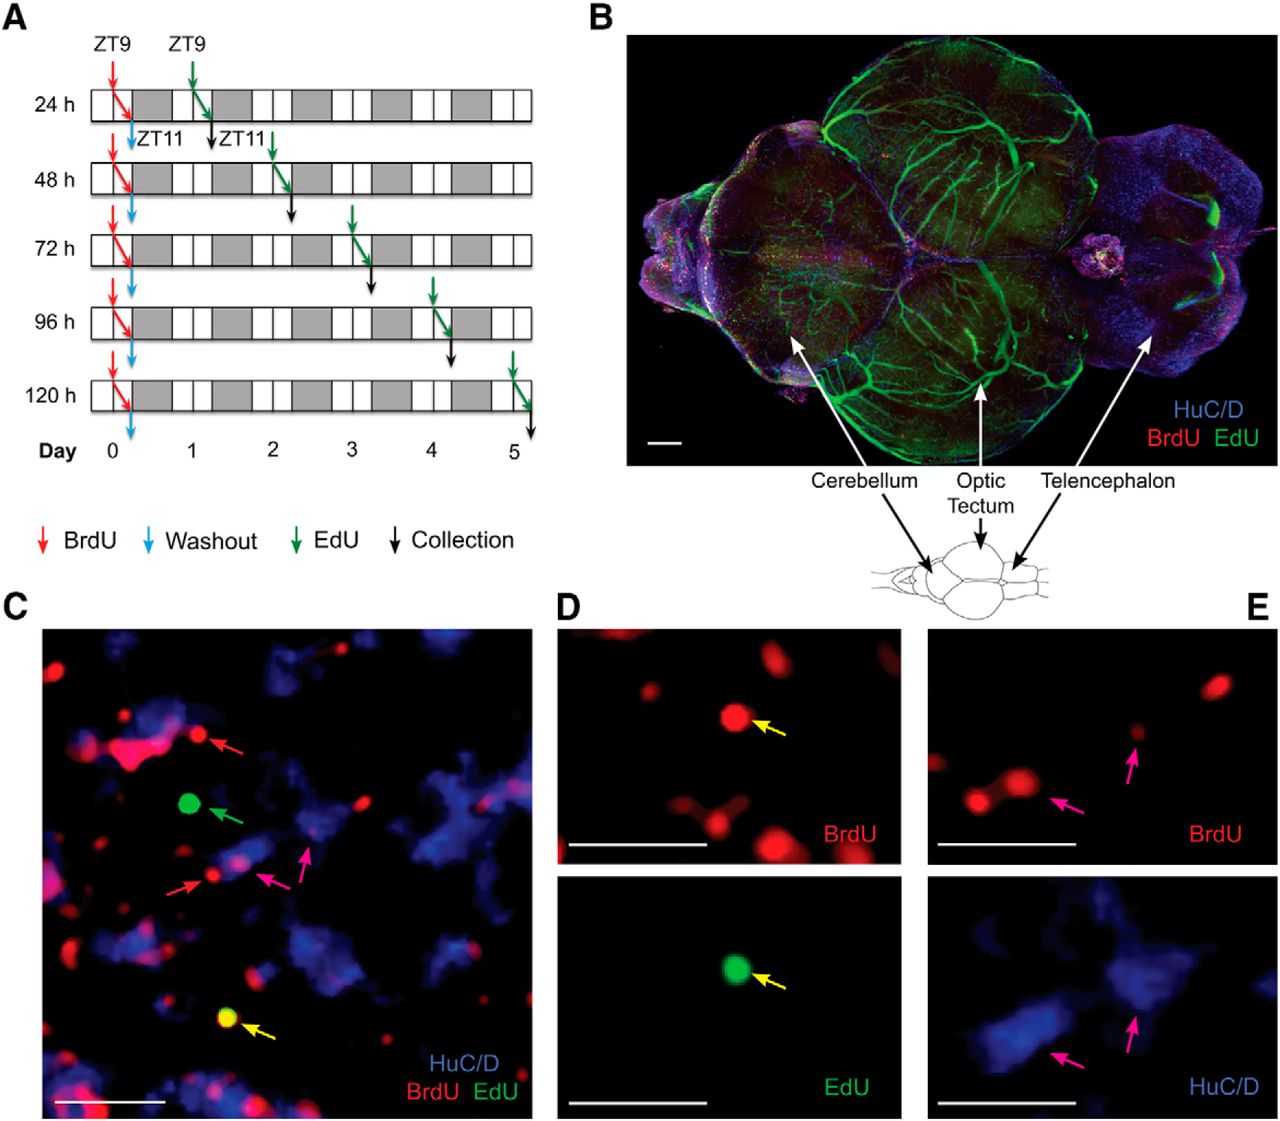
Fig. 2
The pulse-chase BrdU-EdU protocol reveals proliferating cells and newly developing neurons in young adult zebrafish brain. A, Experimental protocol involving BrdU pulse and EdU chase 1–5 d thereafter. Arrows indicate BrdU administration (red), BrdU washout (blue), EdU injection (green), and sample collection (black). BrdU and EdU exposure at ZT9–11, with ZT0 = lights-on time; 14:10 light-dark cycle. White area represents light. Gray area represents dark. N = 5 or 6 fish per time point. B, Cleared zebrafish brain following a 15 d pulse-chase. Scale bar, 150 μm. C, Labeled cells within cerebellar neurogenic niche, following 15 d chase. Arrows indicate BrdU/EdU colocalization (yellow), EdU-only (green), BrdU-only (red), and BrdU/HuC/D colocalization (magenta). Scale bar, 10 μm. D, Single-channel images for the colabeled yellow stem cell in C, BrdU (red) and EdU (green) representing NSCs. E, Single-channel images for cells colabeled for BrdU (red) and HuC/D (blue), representing immature neurons. Scale bar, 10 μm.