
|
Fig. S1
Chemical Screening Identifies Mitogenic Effects of Vitamin D in
Zebrafish (Related to Figure 1)
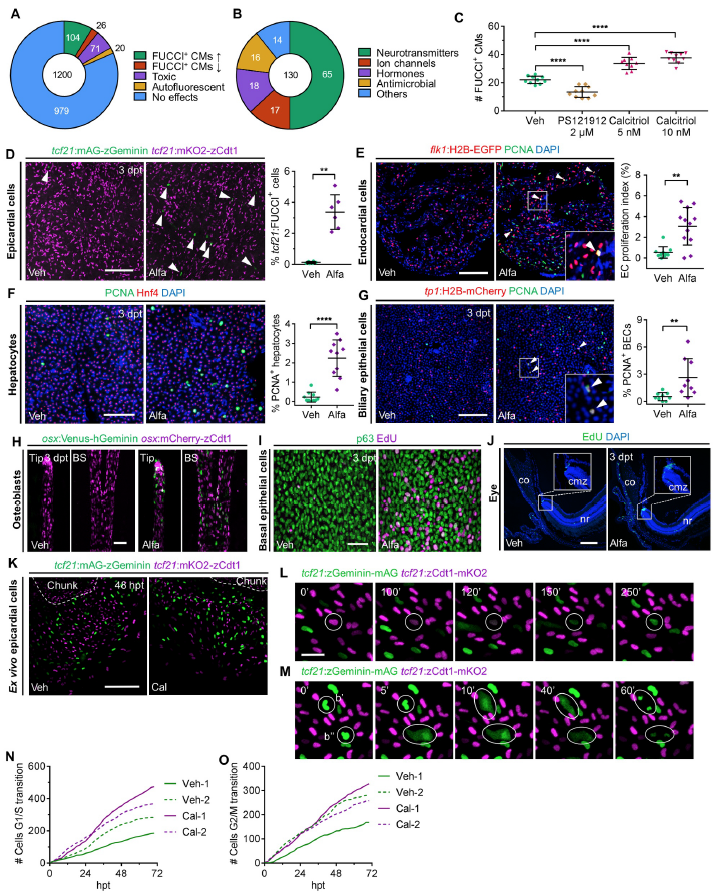
(A) Distribution of the effects of 1,200 compounds from primary screen on CM
proliferation.
(B) Functional grouping of 130 compounds with effects on CM proliferation.
(C) Quantification of FUCCI+ CMs in larvae treated with vehicle, 2 μM PS121912 or 5,
10 nM calcitriol. n = 10, 10, 9, 10, respectively.
(D) Whole-mount images and quantification of epicardial cell proliferation from the
cardiac surfaces of adult tcf21:FUCCI fish injected with vehicle or Alfa. FUCCI+
epicardial cells are defined as mAG-zGeminin+; mKO2-zCdt1− cells (arrowheads). n = 6
for both groups. **p < 0.01. Scale bar, 100 μm.
(E) Section images and quantification of PCNA+ endocardial cells (flk1:H2B-EGFP+) of
adult zebrafish injected with vehicle or Alfa. Arrowheads indicate proliferating
endocardial cells. n=10, 12 respectively. **p < 0.01. Scale bar, 100 μm.
(F) Section images and quantification of PCNA+ hepatocytes (Hnf4+) of adult zebrafish
injected with vehicle or 0.8 μg Alfa. n = 10 for both groups. ****p < 0.0001. Scale bar, 50
μm.
(G) Section images and quantification of PCNA+ billary epithelial cells (BECs) (tp1:H2BmCherry+)
of adult zebrafish injected with vehicle or Alfa. Arrowheads indicate
proliferating BECs. n = 9 for both groups. **p < 0.01. Scale bar, 100 μm.
(H) Maximum intensity projection images of caudal fin rays from osx:FUCCI fish injected
with vehicle or 0.8 μg Alfa. Fin rays were imaged at distal tip regions (Tip) and the first
bifurcation sites (BS). n = 10 for both groups. Scale bar, 50 μm.
(I) Images of whole-mounted caudal fins stained for p63 (to mark basal skin epithelial
cells; green) and incorporated EdU (magenta), from animals treated with vehicle or 0.8
μg Alfa. EdU was injected 6 hours before fin collection. n = 3 for both groups. Scale bar,
50 μm.
(J) Section images of eye tissue from adult zebrafish injected with vehicle or 0.8 μg Alfa,
stained for EdU incorporation. EdU was injected 24 hours before eye collection. Insets
show higher magnification views of the boxed regions. co, cornea; cmz, ciliary marginal
zone; nr, neural retina. n = 9, 11 respectively. Scale bar, 100 μm.
(K) Representative images of ex vivo cultured epicardial explants treated with vehicle or
1 μM calcitriol for 48 hours. Dashed lines represent the outlines of adult tcf21:mAGzGeminin;
tcf21:mKO2-zCdt1 chunk explants. Cal, calcitriol. Scale bar, 200 μm.
(L) zCdt1-mKO2 was degraded followed by zGeminin-mAG accumulation in the circled
cell at indicated times, reflecting G1-to-S transition. Scale bar, 20 μm.
(M) In the circled cells, nuclear zGeminin-mAG proteins diffused throughout the cells
and gradually relocalized to two presumed daughter nuclei, reflecting G2-to-M
transitions and cell divisions.
(N) Cumulative frequencies of cells undergoing G1/S transition of two vehicle (Veh) and
calcitriol (Cal)-treated ex vivo explants respectively shown in (K) over a 69-hour period.
(O) Cumulative frequencies of cells undergoing G2/M transition of two vehicle (Veh) and
calcitriol (Cal)-treated ex vivo explants respectively shown in (K) over a 69-hour period.
Reprinted from Developmental Cell, 48(6), Han, Y., Chen, A., Umansky, K.B., Oonk, K.A., Choi, W.Y., Dickson, A.L., Ou, J., Cigliola, V., Yifa, O., Cao, J., Tornini, V.A., Cox, B.D., Tzahor, E., Poss, K.D., Vitamin D Stimulates Cardiomyocyte Proliferation and Controls Organ Size and Regeneration in Zebrafish, 853-863.e5, Copyright (2019) with permission from Elsevier. Full text @ Dev. Cell