
Image
|
Figure Caption
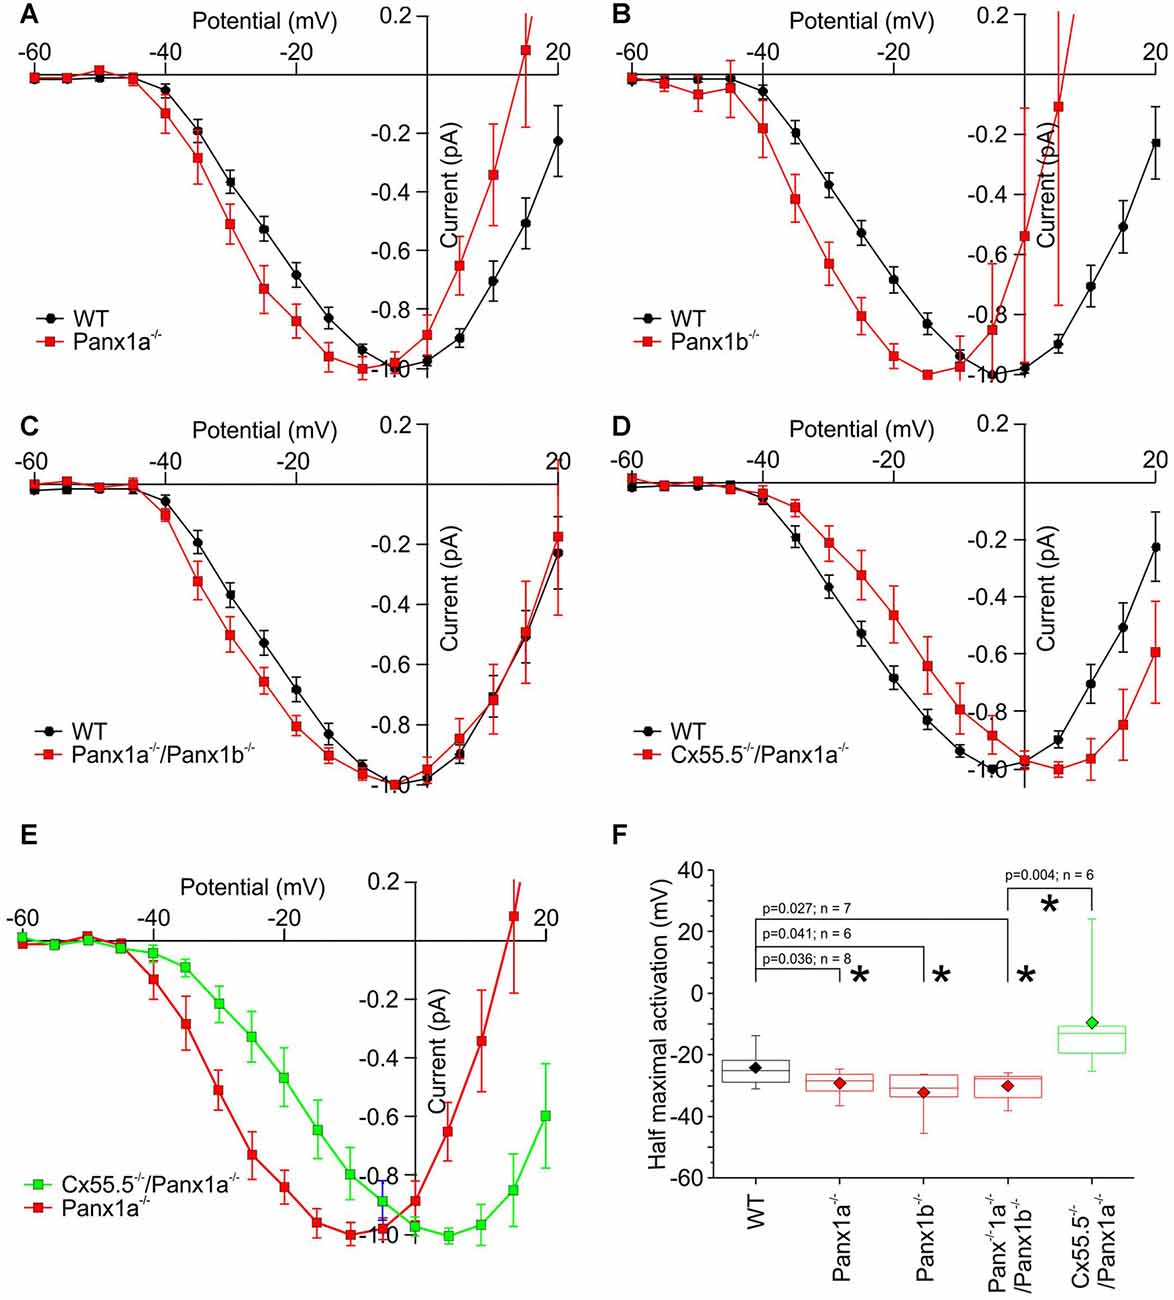
Fig. 6 Normalized IV-relations of the cone Ca-current in WT and the various mutant animals. (A–C) In all Panx1 mutants the half activation potential of the Ca-current shifts to negative potentials. (D) In the Cx55.5−/−/Panx1a−/− animals, the Ca-current shift slightly to positive potentials. (E) The activation function of ICa has shifted strongly to positive potentials in the Cx55.5−/−/Panx1a−/− animals compared to the Panx1a−/− animals (Red curve). (F) Quantification of the shifts of the Ca-current in cones. *p < 0.05.
Figure Data
Acknowledgments
This image is the copyrighted work of the attributed author or publisher, and
ZFIN has permission only to display this image to its users.
Additional permissions should be obtained from the applicable author or publisher of the image.
Full text @ Front. Mol. Neurosci.