
Image
|
Figure Caption
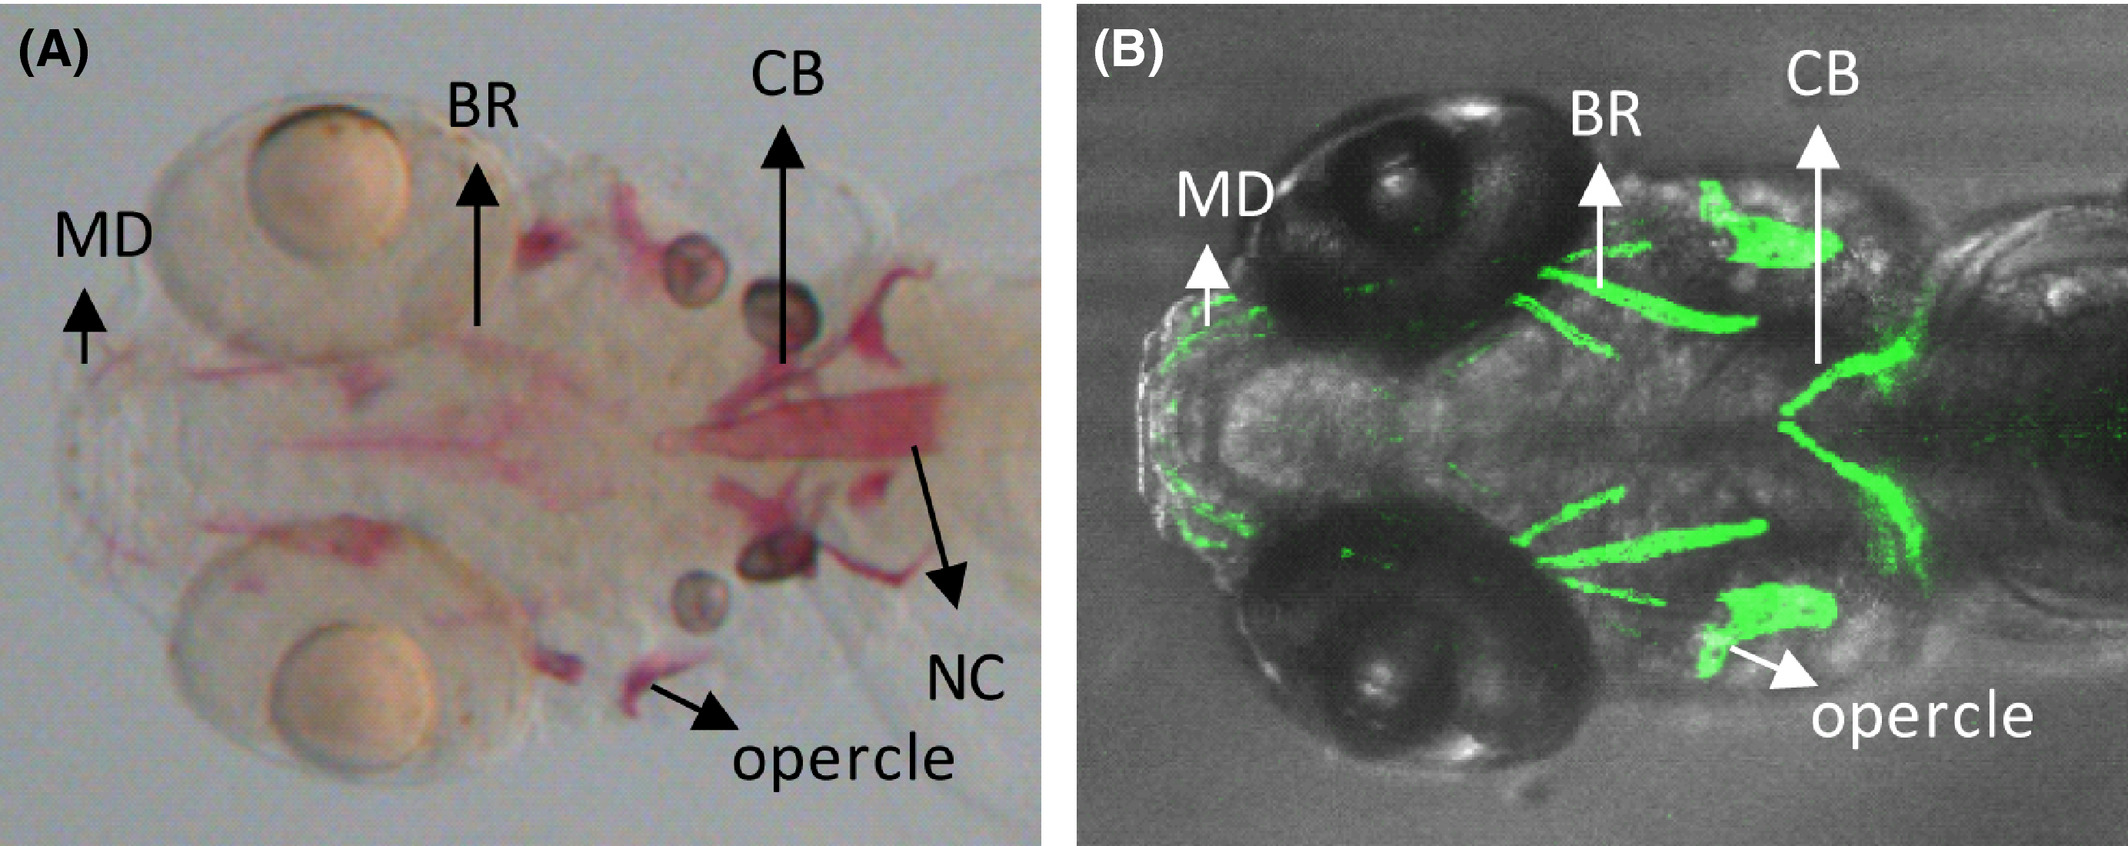
Fig. 3
Comparison of GFP‐labeled cephalic bones in Tg(ola.sp7:nlsGFP) zebrafish to alizarin red‐stained cephalic bones at 8 dpf. (A), Alizarin red stains mineralized bones in zebrafish head region, including cleithrum, opercle, branchiostegal rays, mandible, and notochord. (B), 3D‐reconstructed confocal image of Tg(ola.sp7:nlsGFP) zebrafish larvae. In comparison with alizarin red‐stained fish, eGFP is not expressed in the notochord of transgenic fish. CT, cleithrum; BR, branchiostegal rays; MD, mandible; NC, notochord
Acknowledgments
This image is the copyrighted work of the attributed author or publisher, and
ZFIN has permission only to display this image to its users.
Additional permissions should be obtained from the applicable author or publisher of the image.
Full text @ Animal Model Exp Med