
|
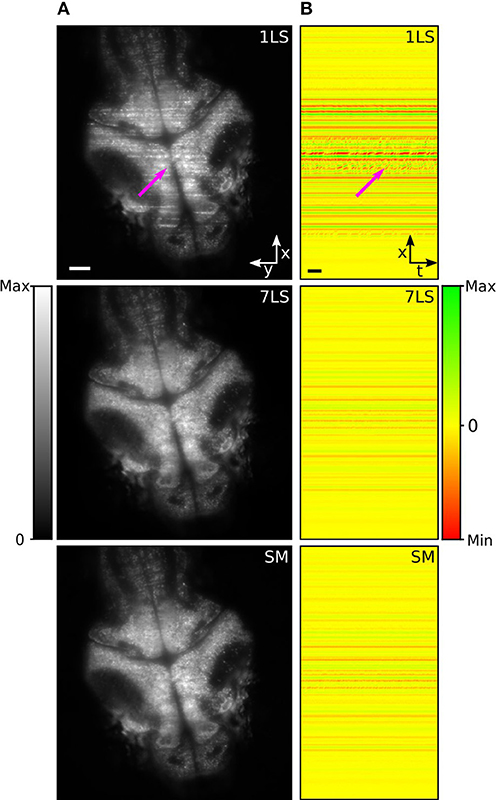
Fig. 3
LSFM images of a zebrafish-larva brain taken with either a single or seven static light-sheets or with a single pivoted one. (B) Maps of spatial correlation along the x-axis (integrated over the y-axis), for the respective illumination configurations, with respect to the modeled stripe artifact. The images were generated by color-mapping the Pearson correlation coefficient, as detailed by the color bar, and the results for the different temporal frames of the time-lapse acquisition are displayed along the horizontal dimension. A subset of stripe artifacts produces fluorescence variations over time that lead to intermittent features in the correlation maps, like the one marked by the arrow. A second arrow in (A) marks the position of the corresponding artifact in the original image. Size scale bars of 50 μm, time scale bar of 2 s.