
|
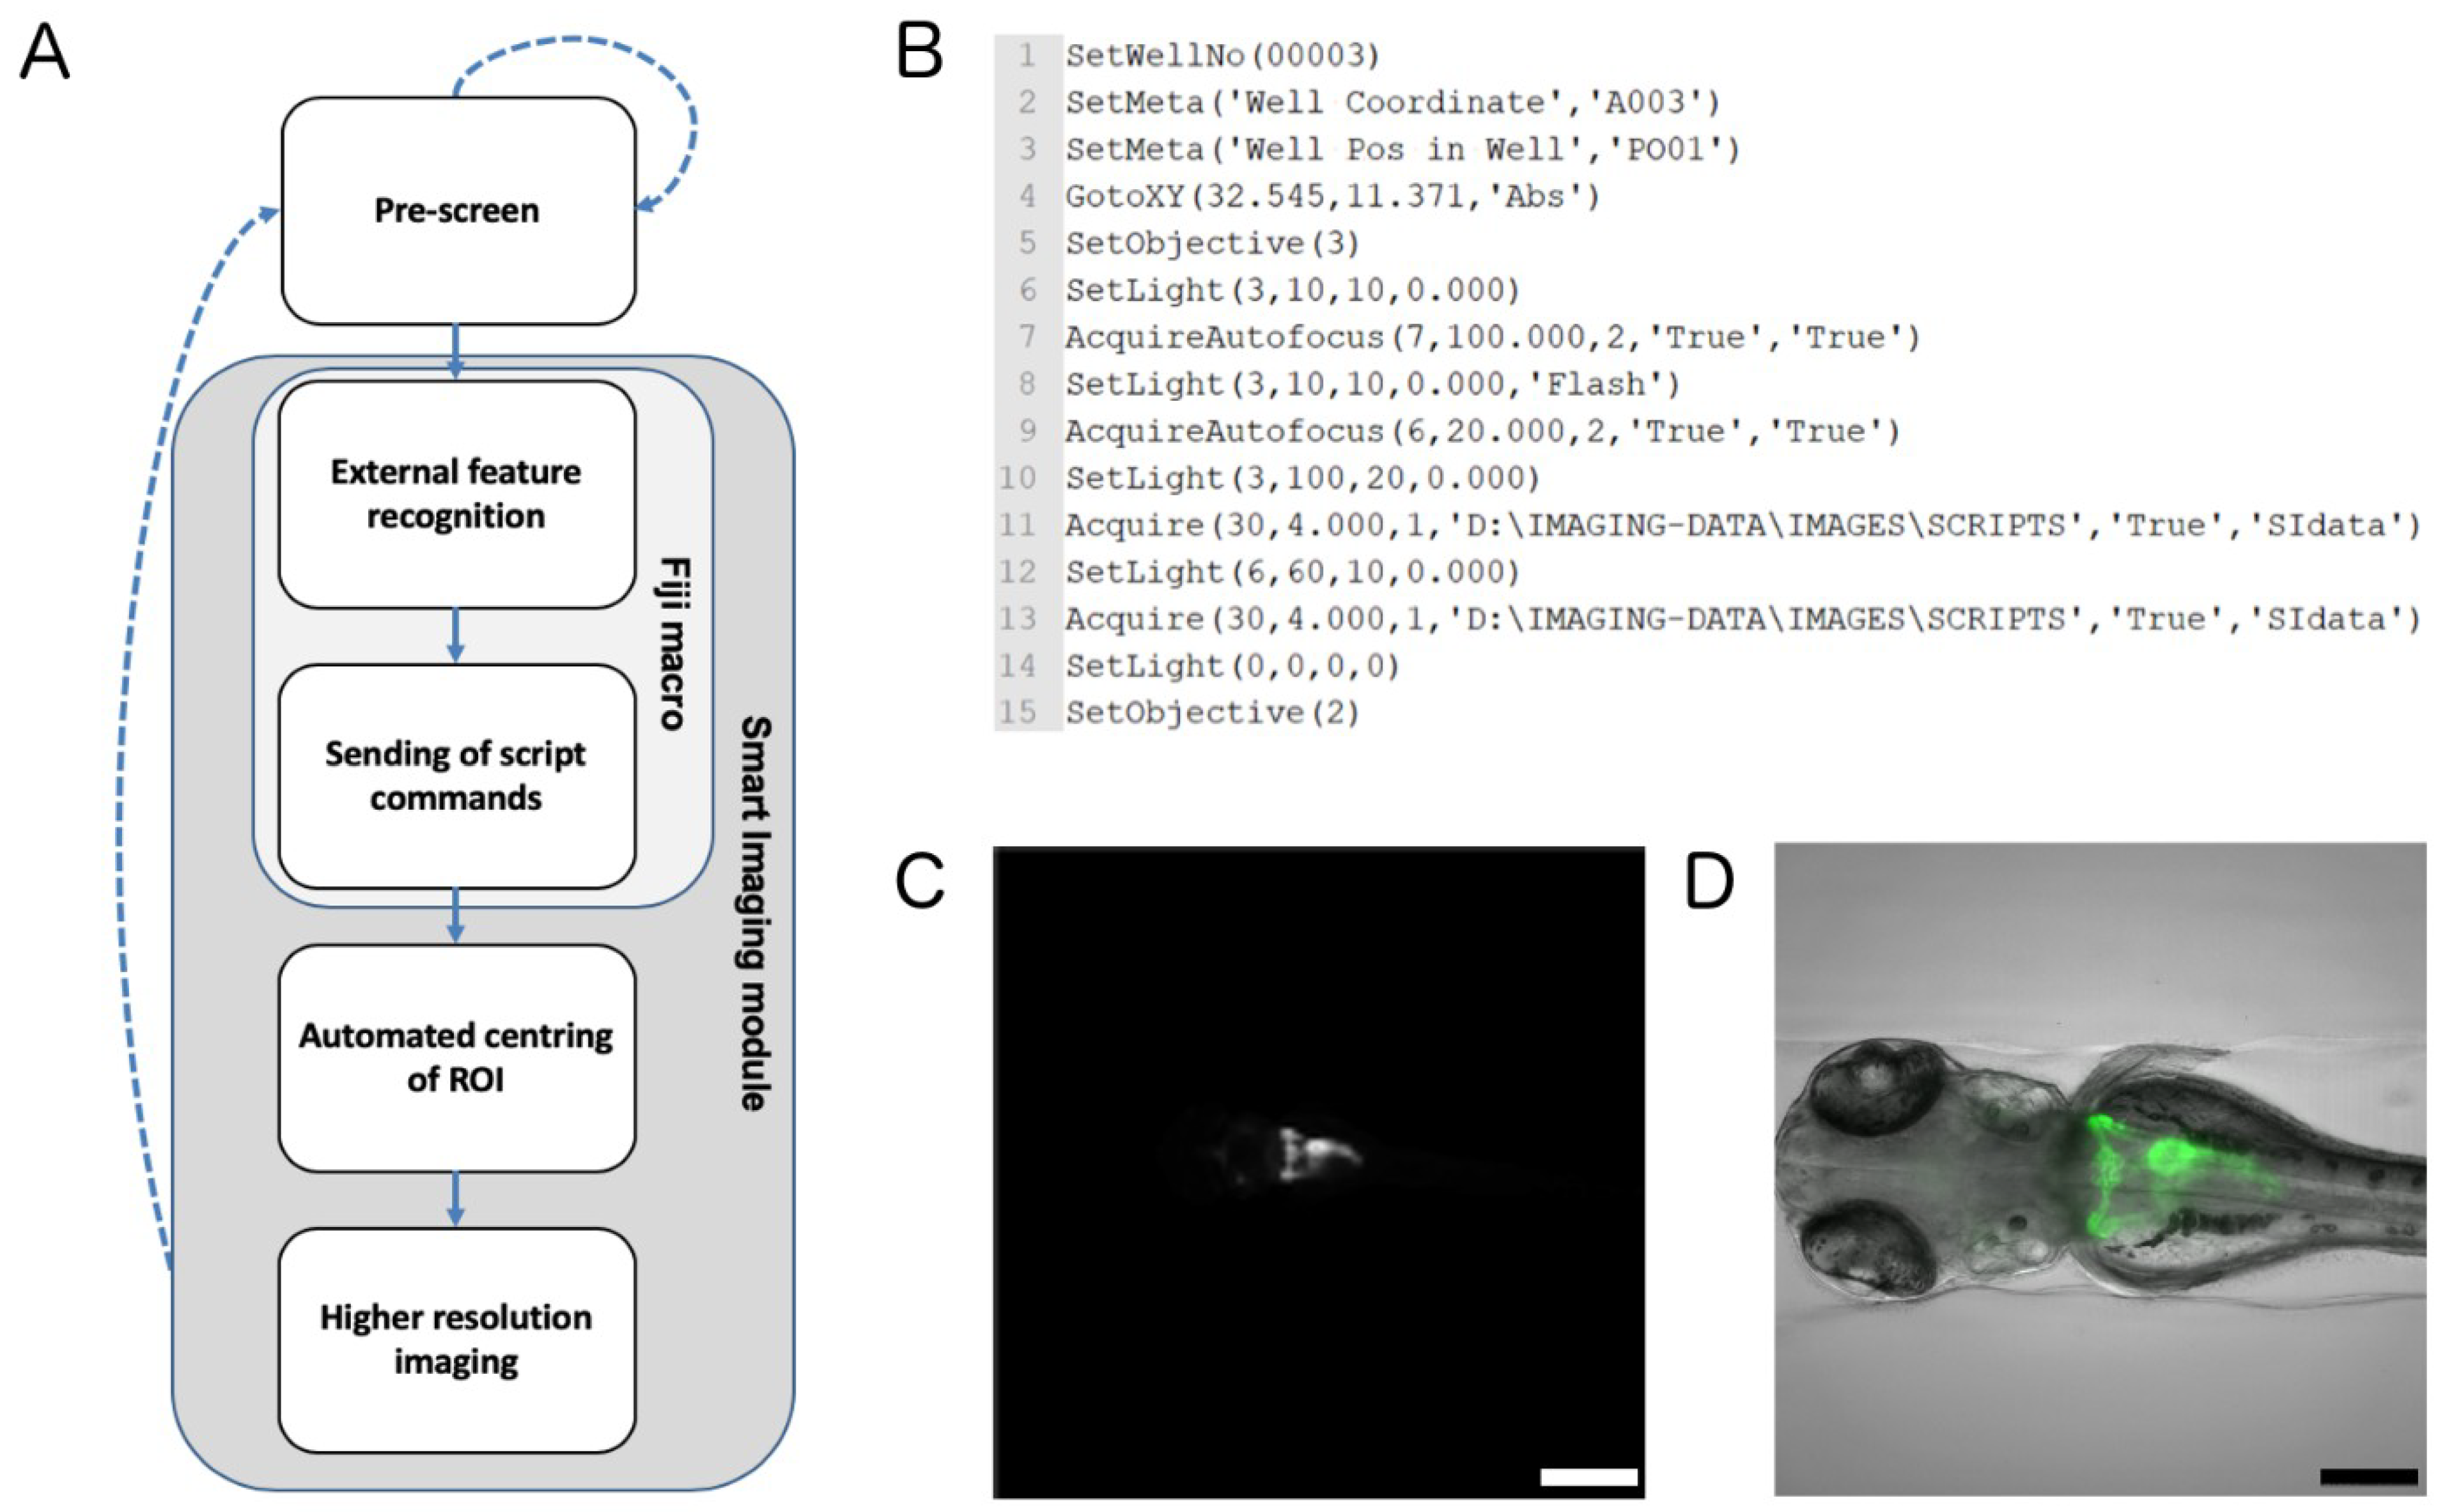
Fig. 2
Smart imaging workflow for automated imaging of kidney regions. (A) Workflow chart illustrating the feedback microscopy approach utilised to automatically acquire regions of interest (ROIs). Dotted arrows indicate imaging components of the pre-screen; solid arrows indicate image processing and higher resolution imaging procedures of the smart imaging module. (B) Example of script commands for a single well that are sent to the automated microscope. The script triggers automated centring of the region of interest and high-resolution acquisition. (C) Representative overview image taken with 4x objective followed by (D) centring and higher resolution imaging of the pronephric region with 10x objective. The image shows a maximum projection of the GFP channel overlaid with the bright-field channel. Scale bar in C is 500µm and scale bar in D is 200 µm.