
Image
|
Figure Caption
Fig. 9
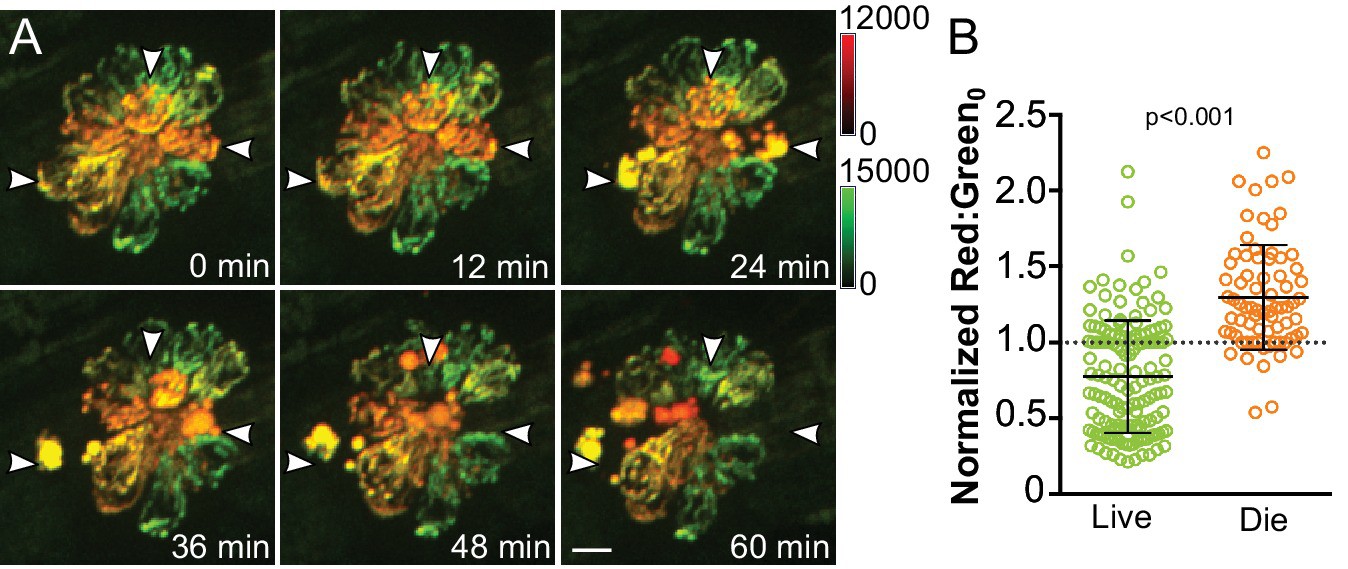
Cumulative mitochondrial activity reflects the likelihood of hair cell death following neomycin-induced damage.
(A) Frames from a time-lapse imaging video acquired from Tg[myo6b:mitoTimer]w208 fish treated with 50 μM neomycin. Images are maximum projections. Arrowheads indicate dying cells. (B) Baseline mitoTimer fluorescence ratio for living and dying cells following neomycin exposure. mitoTimer ratios are normalized to the median, which is indicated by the dotted line. Live: 0.77 ± 0.37, n = 142 cells; Die: 1.30 ± 0.34, n = 74 cells; mean ratio (normalized) ±SD; six fish, 2–3 neuromasts per fish. Mann-Whitney U test was used to assess significance. Scale bar = 5 μm.
Figure Data
Acknowledgments
This image is the copyrighted work of the attributed author or publisher, and
ZFIN has permission only to display this image to its users.
Additional permissions should be obtained from the applicable author or publisher of the image.
Full text @ Elife