
|
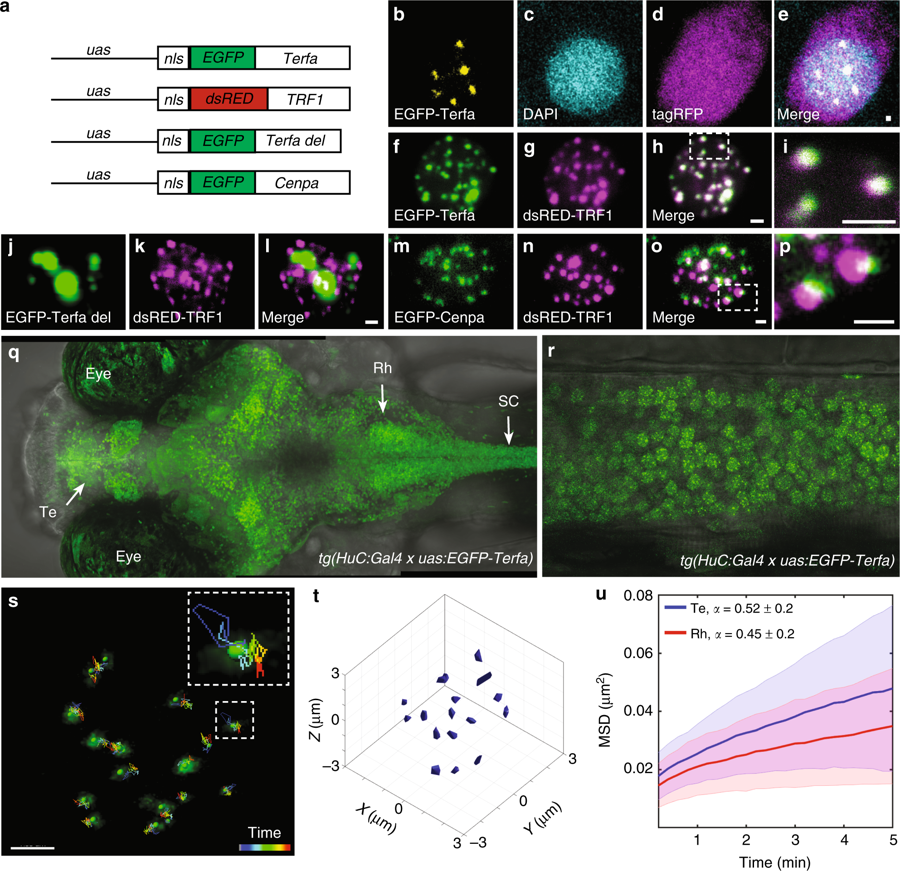
Fig. 1
Imaging single chromosome dynamics in live larvae. a The DNA constructs were used to express telomere, centromere, and truncated telomere markers. b–e One-plane view of a representative neuron that expresses cellular tagRFP (magenta) and nuclear EGFP-Terfa (yellow) telomeric markers in live larvae. f–i Co-localization of zebrafish (f) and human (g) telomeric markers in the nucleus of a zebrafish neuron. j–l Co-expression of truncated zebrafish (j) and human (k) telomeric markers. m–p Co-expression of centromere (m) and telomere (n) markers. Dorsal (q) and lateral (spinal cord, r) views of 6-dpf tg(HuC:Gal4)/tg(uas:EGFP-Terfa) larvae (Te telencephalon, Rh rhombencephalon, SC spinal cord). s Live time-lapse imaging of a single neuron nucleus shows the movement of chromosomes measured over 9.5 min. Dashed box shows high magnification of a single trajectory. t 3D single-particle tracking (SPT) shows the volume of motion of chromosomes in a single nucleus. u In all Te and Rh neurons, the time-averaged mean square displacement (MSD) for telomeres trajectory (Te: n = 340 chromosomes, Rh: n = 475 chromosomes). Lines represent the means, and the shaded area represents the standard deviation (SD). Scale bar = 1 µm