
Image
|
Figure Caption
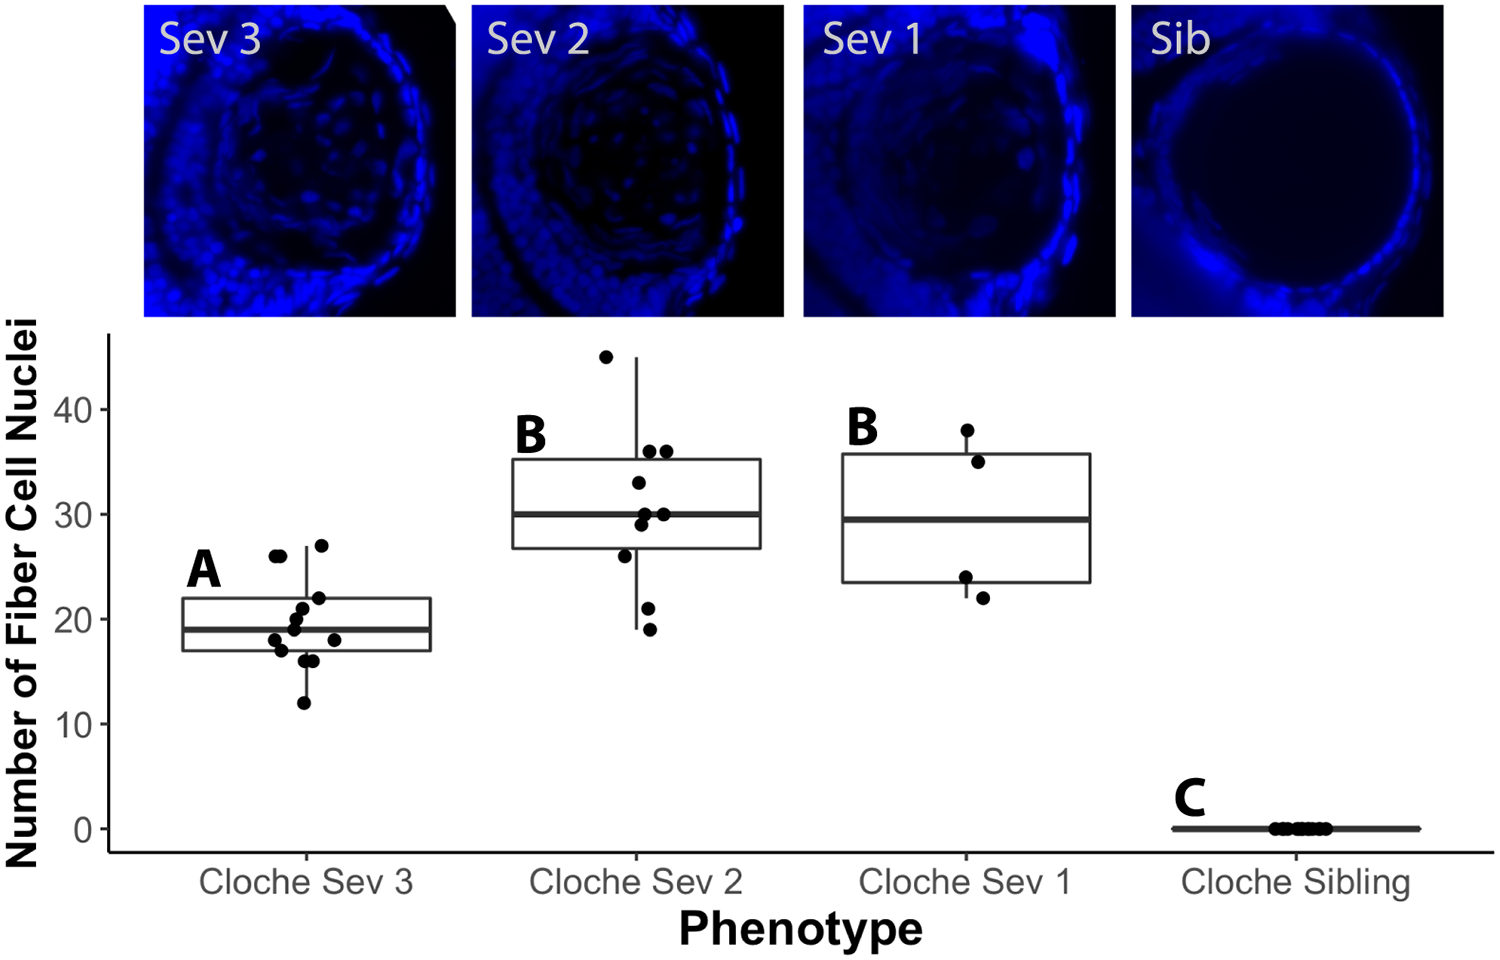
Fig. 3
Quantification of retained fiber cell nuclei in cloche lenses of different phenotype severity compared to non-phenotype siblings by DAPI staining.
Images above the graph show representative lenses for each severity type at 4 dpf. Fiber cell nuclei were significantly more abundant in all cloche lenses compared to siblings. Within cloche embryos, severity type 3 lenses (the most severe) contained fewer nuclei than severity type 2 or 1 (ANOVA p value < 0.0001; letters indicate statistical groups determined by Tukey Honest Significant Difference (HSD) post test).
Figure Data
Acknowledgments
This image is the copyrighted work of the attributed author or publisher, and
ZFIN has permission only to display this image to its users.
Additional permissions should be obtained from the applicable author or publisher of the image.
Full text @ PLoS One