
|
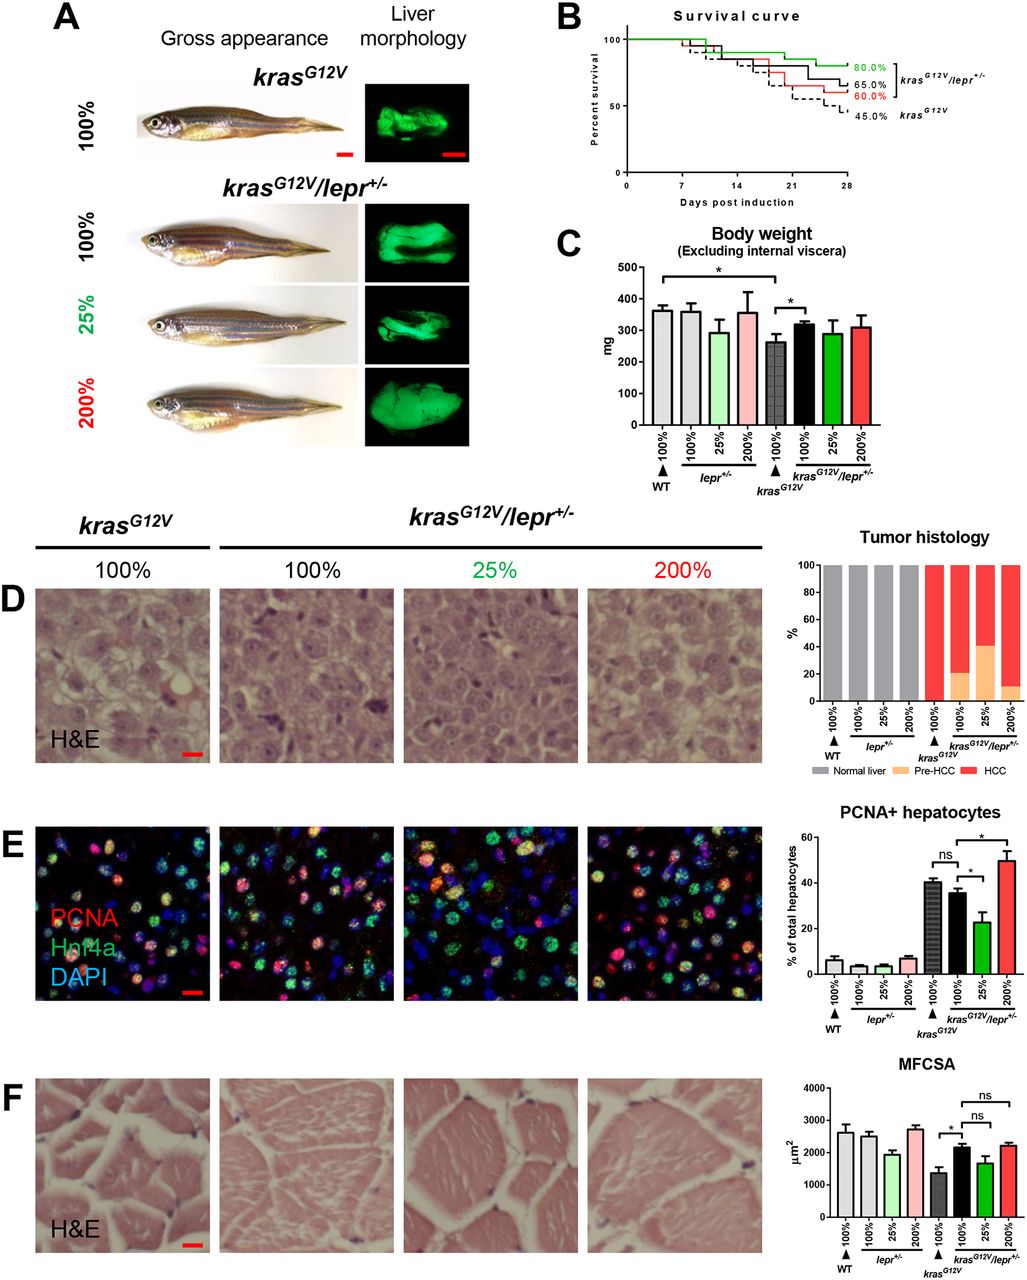
Fig. 5
krasG12V induction in lepr heterogeneous mutant fish under different levels of feeding. lepr+/− fish with and without krasG12V were fed with 25%, 100% and 200% of artemia. Non-mutant WT and krasG12V fish were fed with 100% of artemia as controls for 4 weeks. In each feeding group, 20 fish were used to initiate the experiments. (A) Gross appearance and liver morphology based on liver-specific GFP expression in krasG12V fish. (B) Survival curves. (C) Body weight excluding internal viscera. (D) H&E staining of liver sections (left) and quantification (right). (E) IF staining of PCNA (red), Hnf4a (green) and DAPI (blue). Quantification of percentages of proliferating hepatocytes is presented on the right. (F) H&E staining of muscle sections (left) and quantification of MFCSA (right). *P<0.05. Scale bars: 2.5 mm in A; 10 μm in D-F.