
|
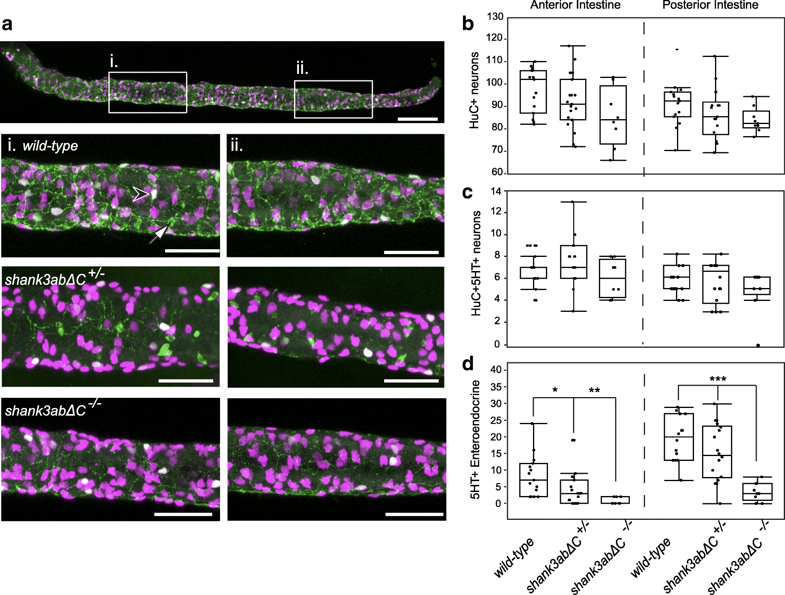
Fig. 7
Shank3abΔC mutants have a reduction in enteroendocrine cells. a Anterior (i.) and posterior (ii.) regions were sampled to quantify the number of enteric neurons (HuC, magenta), serotonin enteric neurons (HuC+/5-HT+, white, black arrowhead), and enteroendocrine cells (5-HT+, green, white arrow). Shank3abΔC mutants did not show a significant decrease in either b enteric neurons or c serotonin positive enteric neurons. d Serotonin positive enteroendocrine cells were significantly decreased in shank3abΔC mutants for both anterior and posterior regions. WT, n = 15;shank3abΔC +/−, n = 19; shank3abΔC −/−, n = 9. Scale bars represent 100 μm (a) and 50 μm (i, ii)