
Image
|
Figure Caption
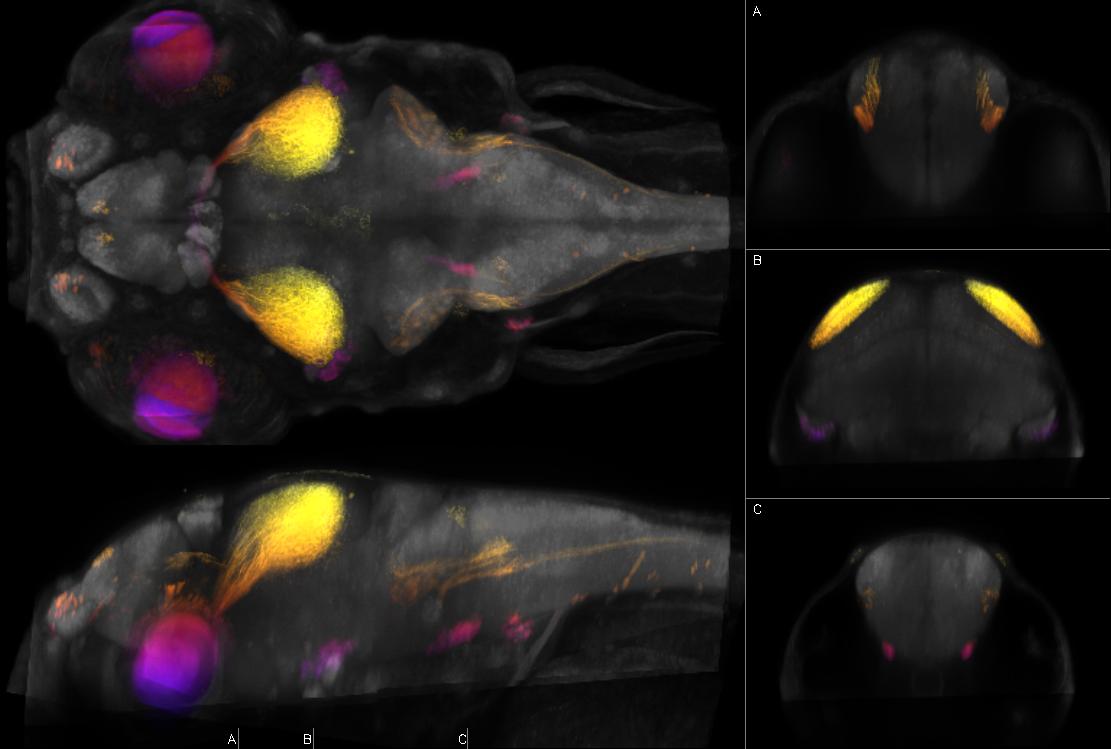
Fig.102 Left: dorsal and sagittal maximal confocal projections from Zebrafish Brain Browser. Right: coronal slices at the indicated levels. Depth coded by color. Intensity represents mean expression in larvae transgenic for y567Et and Tg(UAS:Kaede)s1999t which expresses Kaede in retinal ganglion cell, retinotectal tract (strong), aLLg, pLLg, lateral line (plus innervation of neuromasts), spinal cord, lens (strong)
Figure Data