
|
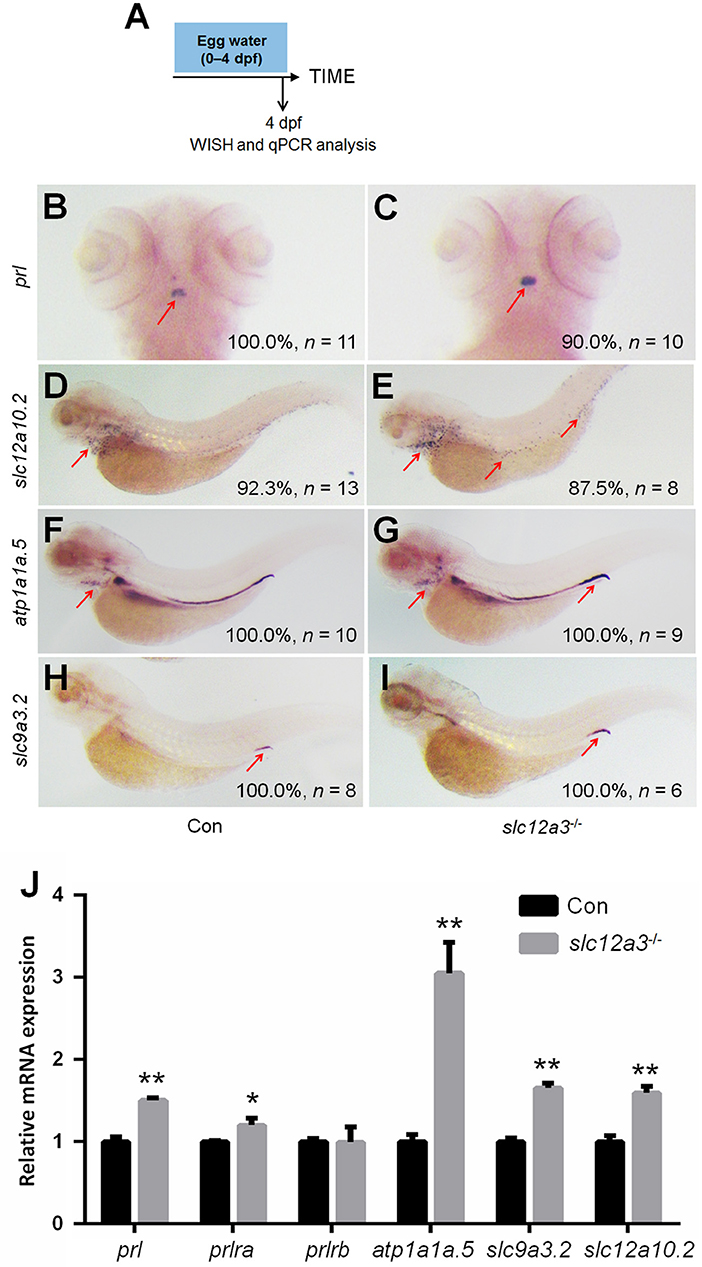
Fig. 6 Expression patterns of prl and PRL targets in the slc12a3-deficient larvae at 4 dpf. (A) Schematic diagram of the rearing timeline. Larvae were harvested at 4 dpf for WISH analysis. (B,C) WISH analysis using the probe of prl in control and slc12a3-deficient larvae at 4 dpf. (D,E) WISH analysis using the probe of slc12a10.2 in control and slc12a3-deficient larvae at 4 dpf. (F,G) WISH analysis using the probe of atp1a1a.5 in control and slc12a3-deficient larvae at 4 dpf. (H,I) WISH analysis using the probe of slc9a3.2 in control and slc12a3-deficient larvae at 4 dpf. Red arrows indicate the expressions of the nominated genes. (J) Expression levels of prl, prlra, prlrb, atp1a1a.5, slc9a3.2, and slc12a10.2 in control larvae and slc12a3-deficient larvae at 4 dpf were examined with qPCR assay. *P < 0.05. **P < 0.01.