
|
Fig. 3
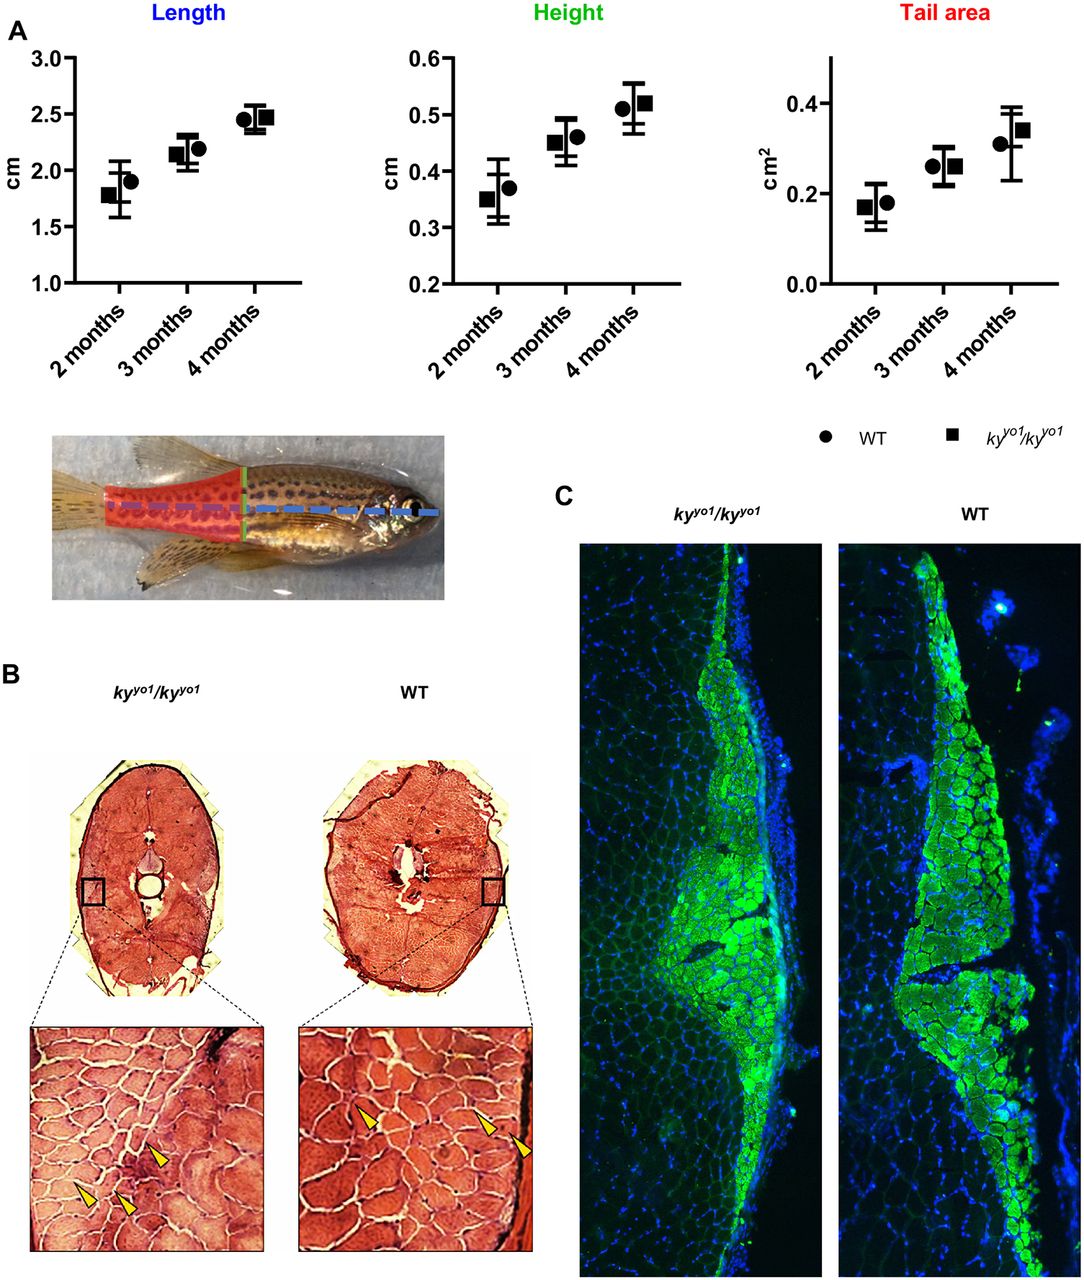
Organism and tissue-level characterisation of the kyyo1/kyyo1 zebrafish shows no overt pathology. (A) Longitudinal growth study shows no difference in kyyo1/kyyo1 zebrafish morphology. Three metrics were assessed in WT and kyyo1/kyyo1 zebrafish at 2, 3 and 4 months post-fertilisation: length (blue) from the jaw to the anterior of the tail fin, height (green) at the anterior of the anal fin, and tail area (red) measured between the anterior of the anal fin and the anterior of the tail fin. No differences were seen between WT and kyyo1/kyyo1 zebrafish. (B) Representative transverse sections of 3-month-old zebrafish show muscle fibres in cross-section. A small number of very small fibres and fibres with centralised nuclei can be seen with similar frequency in both WT and kyyo1/kyyo1 fish (examples indicated by yellow arrows), indicating that these are not pathological changes. (C) Slow muscle distribution is preserved in the kyyo1/kyyo1 zebrafish. Immunofluorescence against the slow-muscle marker (s58) on transverse sections shows that slow muscle remains restricted laterally in the kyyo1/kyyo1 zebrafish. Image representative of sections from two WT and two kyyo1/kyyo1 fish at 6 months post-fertilisation. As sections are derived from different positions on the anterior-posterior axis, slow-muscle area and cell number cannot be directly compared.