
|
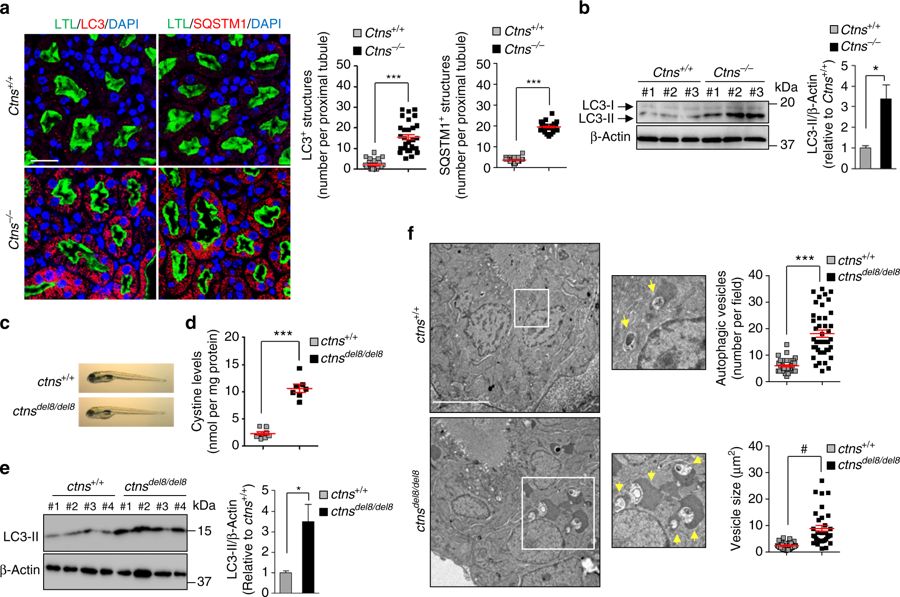
Fig. 2
Cystinosin deficiency alters autophagy in proximal tubules of mouse and zebrafish kidneys. a Representative confocal micrographs and quantification of numbers of LC3+ (left panel; red) or SQSTM1+ structures (right panel; red) in LTL+ (green) proximal tubules in Ctns mouse kidneys (n = 30 proximal tubules pooled from three kidneys per group; each point representing the number of LC3+ or SQSTM1+ vesicles in a proximal tubule; two-tailed unpaired Student’s t-test, ***P < 0.001 relative to Ctns+/+kidneys). Nuclei counterstained with DAPI (blue). b Western blotting and densitometric analyses of LC3 protein levels in whole kidney lysates from Ctns mice (two-tailed unpaired Student’s t-test, *P = 0.029 relative to Ctns+/+ kidneys, n = 3 mice per group). c Representative images of ctns+/+ and ctnsdel8/del8 zebrafish embryos at 5 dpf and d quantification of cystine levels by HPLC in ctns+/+ and ctns del8/del8 zebrafish embryos at 5 dpf (two-tailed unpaired Student’s t-test,***P < 0.001 relative to ctns+/+embryos, n = 8 ctns+/+ zebrafish and n = 7 ctns del8/del8 zebrafish). e Western blotting and densitometric analyses of LC3 protein levels in pronephric tubules from 3-month-old ctns+/+ and ctns del8/del8 zebrafish (n = 4 per group; two-tailed unpaired Student’s t-test, *P = 0.03 relative to ctns+/+ kidneys). f Representative electron micrographs and quantification of numbers and size of autophagic vacuoles in pronephric tubules of ctns+/+ and ctnsdel8/del8 zebrafish embryos at 5 dpf. White squares contain images at higher magnification. Yellow arrowhead indicates autophagic vacuoles. Number of autophagic vesicles: n = 43 (ctns+/+) and n = 42 (ctnsdel8/del8) randomly selected micrographs were pooled from 11 ctns+/+ and 12 ctnsdel8/del8 zebrafish. Average vesicle size: n = 32 (ctns+/+) and n = 33 (ctnsdel8/del8) randomly selected micrographs were pooled from 11 ctns+/+ and 12 ctnsdel8/del8 zebrafish. Two-tailed unpaired Student’s t-test, ***P < 0.001 and #P < 0.0001 relative to ctns+/+ zebrafish. β-Actin was used as a loading control in b and e. Plotted data represent mean ± SEM. Scale bars are 50 μm in a and 5 μm in f