
|
Fig. S2
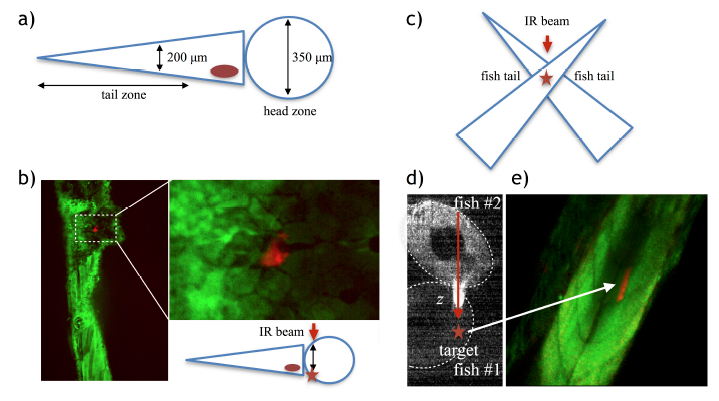
Exploring activation depth. a) Schematic of a 5-7 dpf zebrafish showing relative dimensions. b) Successful labeling (red fluorescence) in the head area after irradiating a patch of 50 μm2, which resulted in an activation area of 150 μm2 corresponding to a single cell and depth z ∼ 200 μm (the boxed area is magnified in the right image, scale bar = 20 μm). c-d) We also designed an experiment where we could irradiate through fish tissue in the tail zone, but deeper than 200 μm. We superposed two fish in a crossed position, as shown in the schematic (c), and irradiated the crossed area using this configuration. We could activate areas of 1600 μm2 passing through tissue length z ∼ 360 μm (d) (Scale bar = 80 μm).