
|
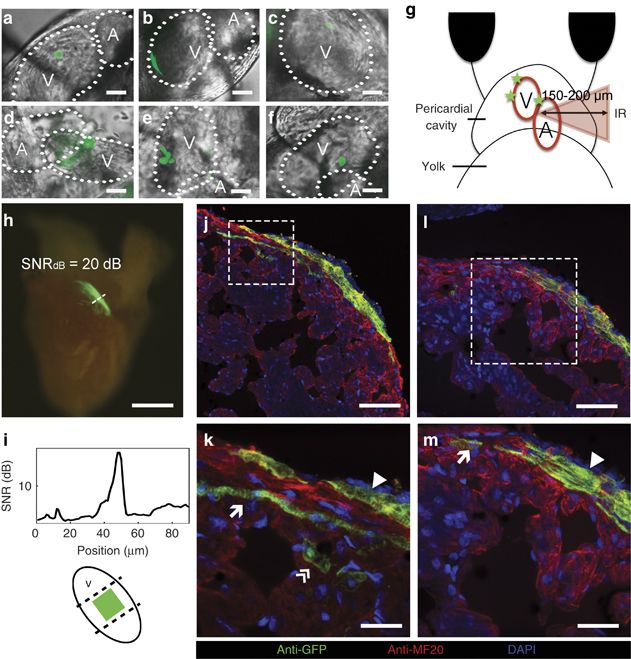
Fig. 4
Long-term in vivo lineage tracing of zebrafish cardiomyocytes. (a–f) Selected areas labeled in the heart of the zebrafish embryo in order of accessibility (scale bar=10 μm, for more details see Materials and Methods): (a, b) approximately100 μm2-labeled areas; (c) a single cell of 100 μm2; (d–f) multiple labeled areas at different locations; and (g) a diagram depicting how areas behind inhomogeneous tissue were labeled at z~150–200 μm. (h) Excised heart of an adult zebrafish. The original ~100 μm2-labeled area was extended to ~0.125 mm2 (scale bar=250 μm); (i) a fluorescence SNR of ~20 dB and the position of the original labeled zone. (j–m) Immunostaining images of the adult zebrafish heart show the participation of the photoactivated cardiomyocytes in the three layers of the heart wall. Scale bars=50 μm (j); 5 μm (k); 20 μm (l); and 10 μm (m). DAPI, 4′,6-diamidino-2-phenylindole; SNR, signal-to-noise ratio.