
|
Fig. S7
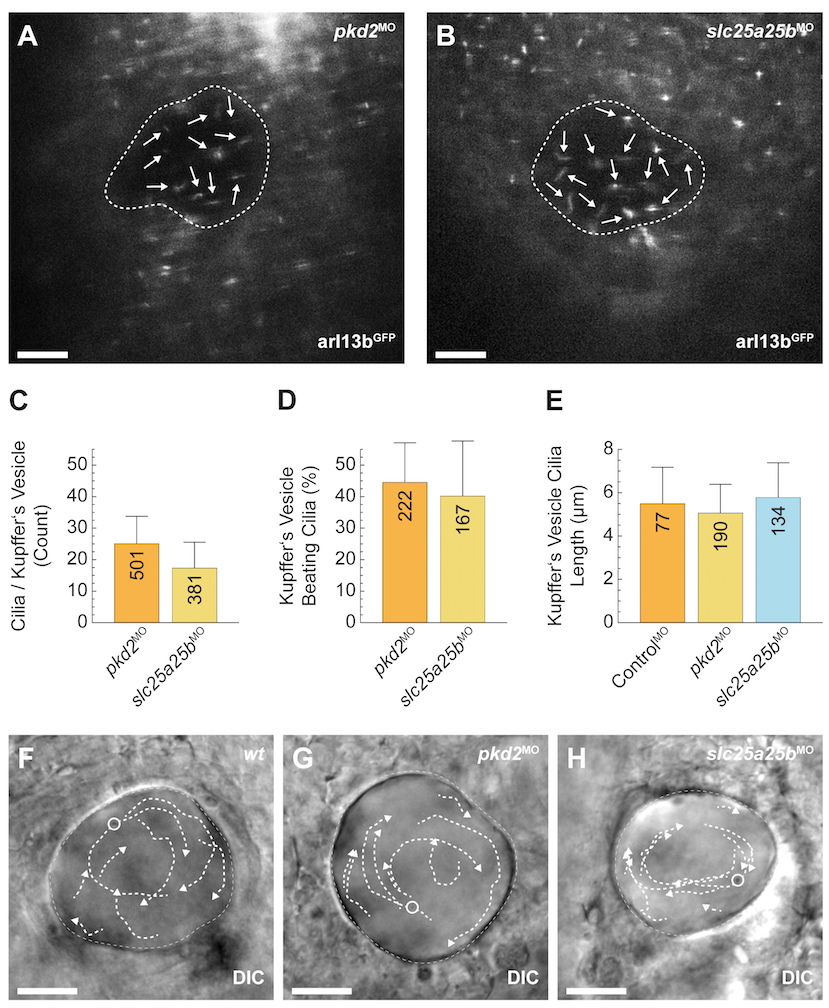
Structure and motility of cilia in zebrafish Kupffer’s vesicle appeared normal at the 8-somite stage.
(A) Still image of S2 Movie from Kupffer’s vesicle of pkd2-morphant embryos shows cilia in 1 focal plane. It has been shown previously that knockdown of pkd2 does not affect cilia number and motility [25]. (B) slc25a25b-morphant Kupffer’s vesicle cilia resembled pkd2-morphant cilia in (C) number, (D) beating, and (E) length. Numbers of cilia are indicated in bars. pkd2MO: n = 20; mean number of cilia / Kupffer’s vesicle = 25.05 (standard deviation = 8.69); percentage of beating cilia = 44.525 (standard deviation = 12.55); average length of cilia = 5.05 μm (standard deviation = 1.33). slc25a25bMO: n = 21; mean number of cilia / Kupffer’s vesicle = 17.32 (standard deviation = 8.2); percentage of beating cilia = 40.154 (standard deviation = 17.5); average length of cilia = 5.77 μm (standard deviation = 1.61). Similar to (F) wild type, (G) pkd2MO and (H) slc25a25bMO fish generate effective directional flow in the Kupffer’s vesicle as visualized by particle tracking at the 8-somite stage [86,87]. No significant differences were observed in flow velocities (wild type: n = 6; mean velocity = 10.2 μm/s; standard deviation = 2.4; pkd2MO: n = 9; mean velocity = 10.4 μm/s; standard deviation = 2.2; slc25a25bMO: n = 10; mean velocity = 7.9 μm/s; standard deviation = 2.2). Scale bars = 20 μm. For numerical values, see S1 Data.