
|
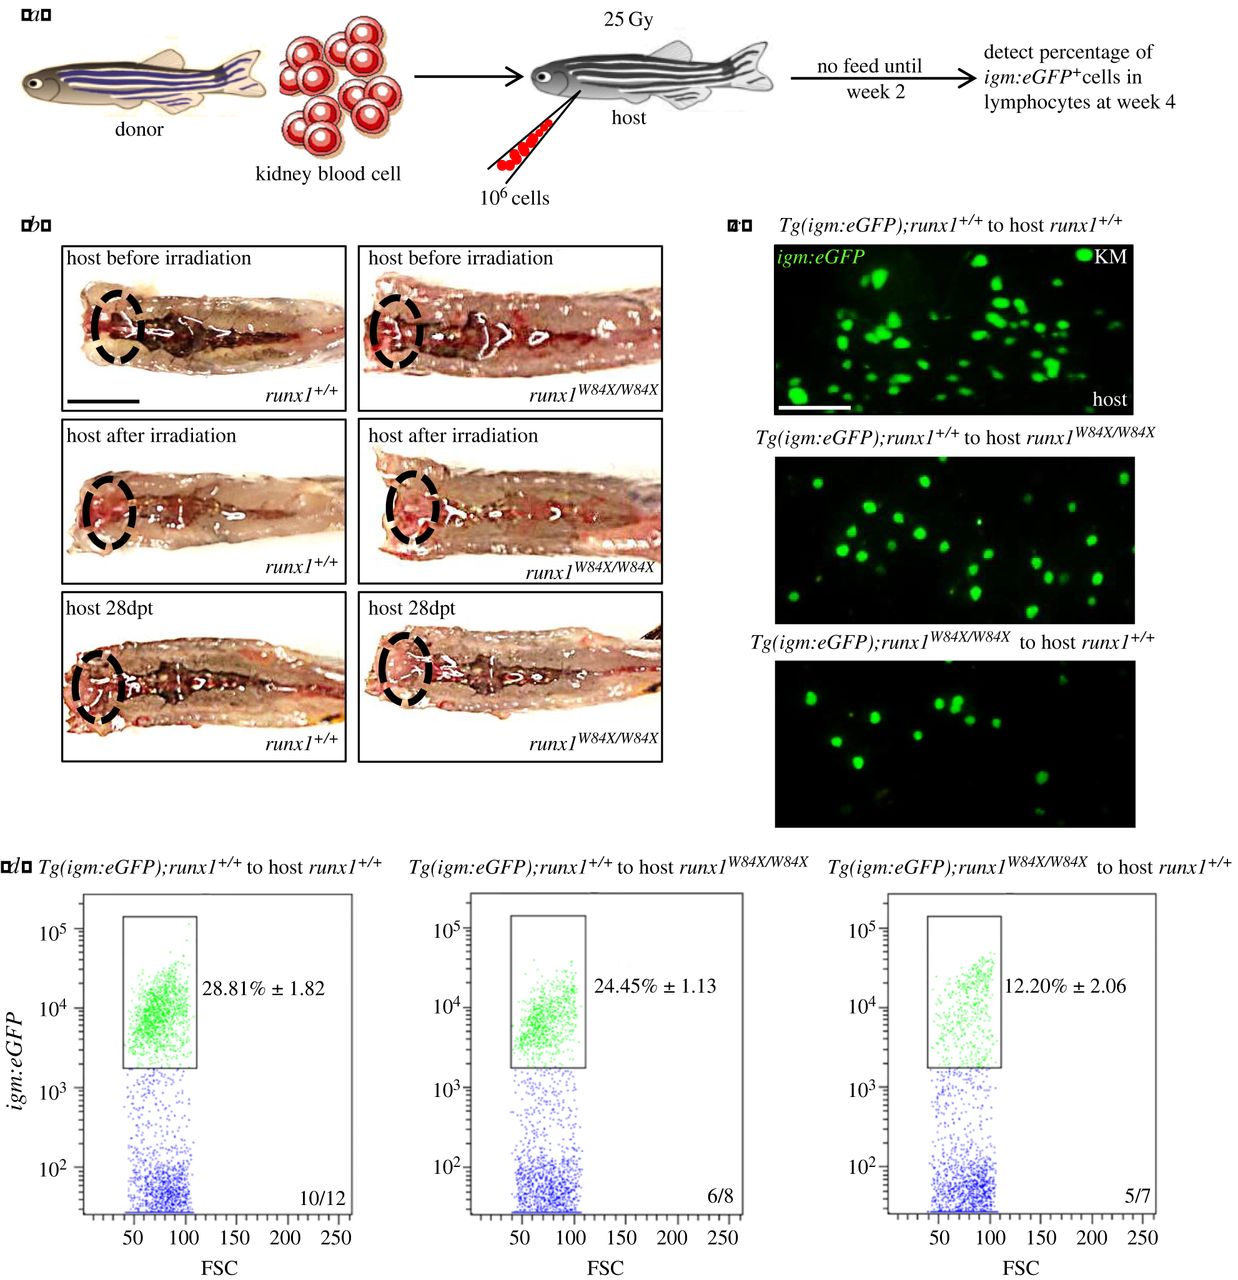
Fig. 4
Cell-autonomous regulation of runx1 in B cells development. (a) Schematic outline showing procedure of transplantation. (b) Macroscopic representation of kidney marrow of donors (top), donors after irradiation (middle) and hosts reconstituted with donors kidney morrow (below, 4 weeks after transplantation). Ovals indicate the locations of the head kidneys; dpt, day post transplantation; scales bars, 5 mm. (c) Fluorescent representation of igm:eGFP+ from reconstituted kidney morrow of hosts (4 weeks after transplantation). Scales bars, 100 µm. (d) Percentage of igm:eGFP+ in lymphocytes from reconstituted hosts kidney marrow were calculated by FACS analysis. Each experiment was performed in duplicate. Black boxes outline the captured igm:eGFP+ cells with fluorescence in lymphocytes region of kidney marrow.