
|
Fig. S4
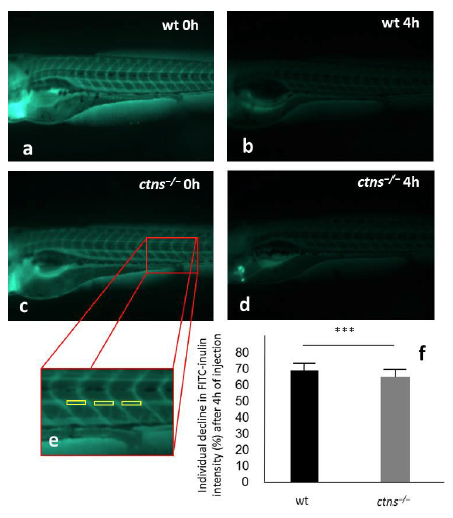
Evaluation of glomerular filtration rate. FITC-inulin was injected into 96 hpf wt and ctns‒/‒ larvae (N=45 and 43, respectively). The fluorescence intensities over the caudal artery were evaluated using ImageJ software at zero and 4h after injection and the percentage of fluorescence decline were calculated separately for each larva. (a) A representative wt larva at 0h post-injection. (b) A representative wt larva at 4h post-injection. (c) A representative ctns‒/‒ larva at 0h post-injection. (d) A representative ctns‒/‒ larva at 4h post-injection. (e) A magnified image showing the exact anatomical positions over the somites 14, 15 and 16 for measuring fluorescence intensities by the ImageJ software. (f) Quantitation of the percentage of fluorescence intensity decline (mean ± SD) after 4h of injection.