
|
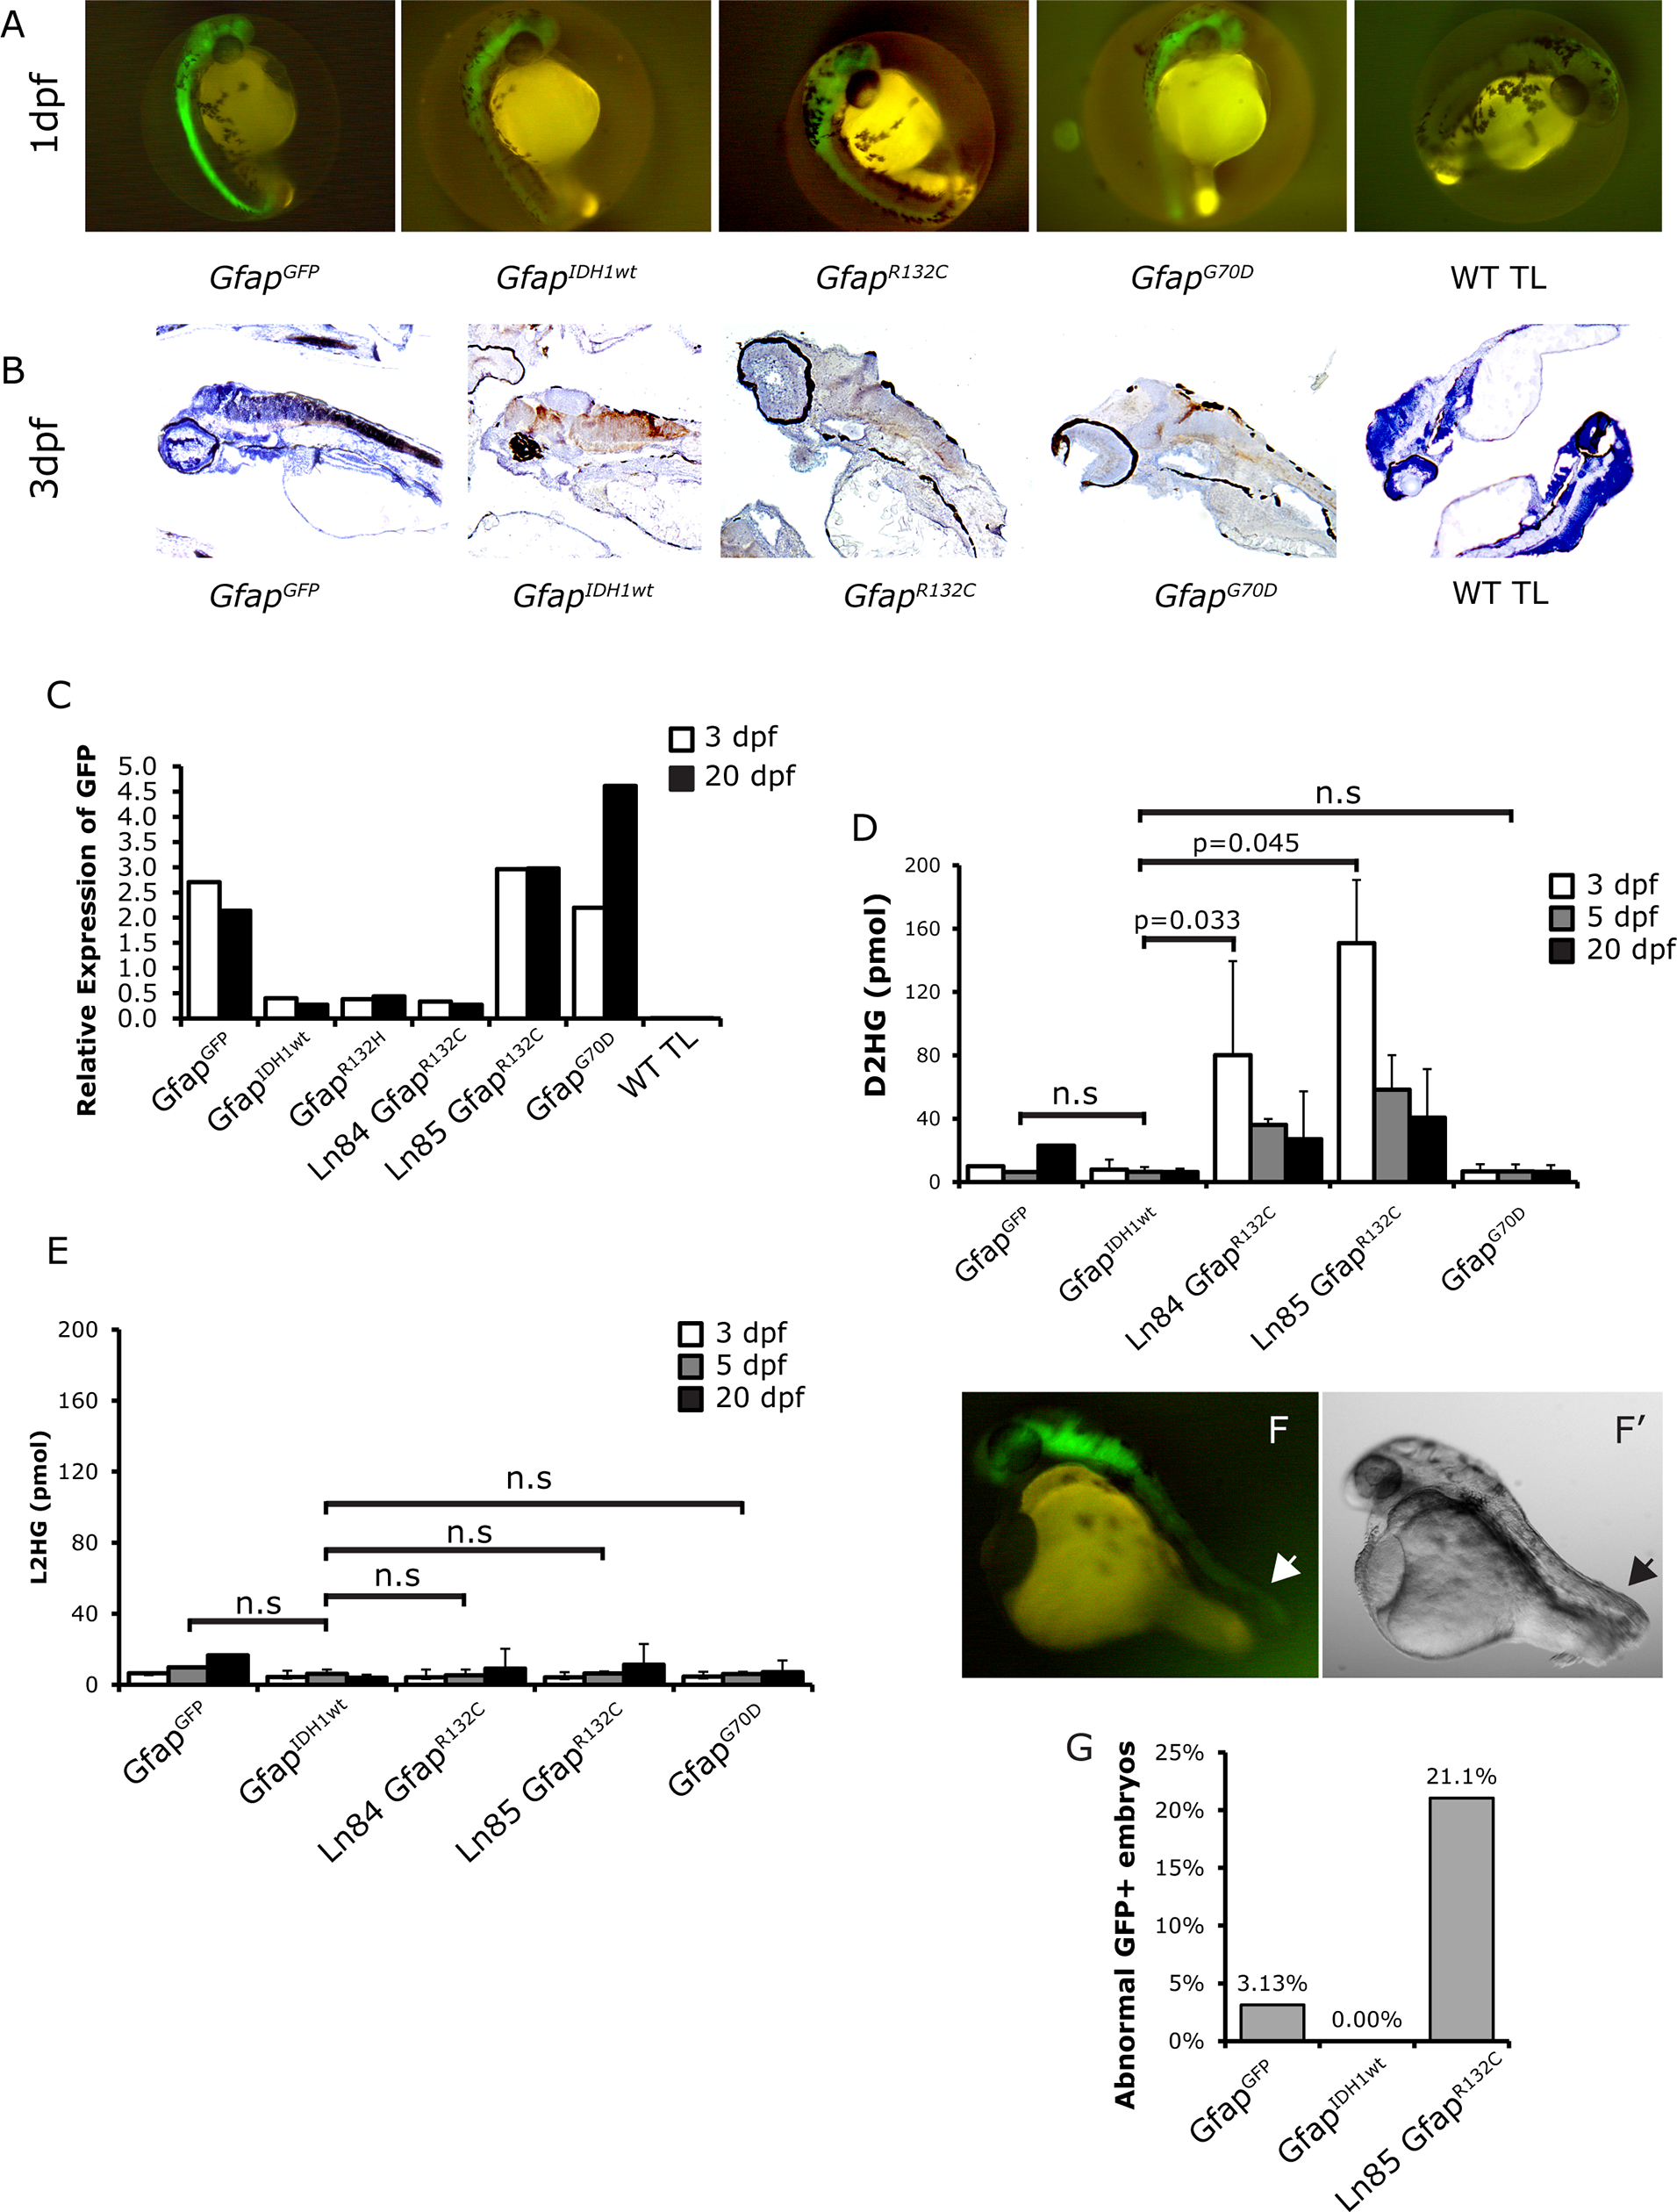
Fig. 2
Characterization of Gfap zebrafish lines.
Expression of transgene was detected using fluorescent imaging (A), immunohistochemistry with an anti-GFP antibody (B) and QPCR (C). Elevated levels of D2HG were only detected in GfapR132C lines (D). L2HG levels in the transgenic fish embryos were not affected (E). About 21% GfapR132C embryos showed defects in tail development on 1dpf (F and G). Arrow heads: the site of abnormal tail development in the GfapR132C embryos. For Q-PCR experiments, we used a pool of five (3dpf) or three (20 dpf) fish per time-point; D2HG and L2HG measurements were averages of two replicates using five (3 and 5 dpf) or three (20 dpf) fish per replicate. Scale bar: 500 μm.