
|
Fig. 1
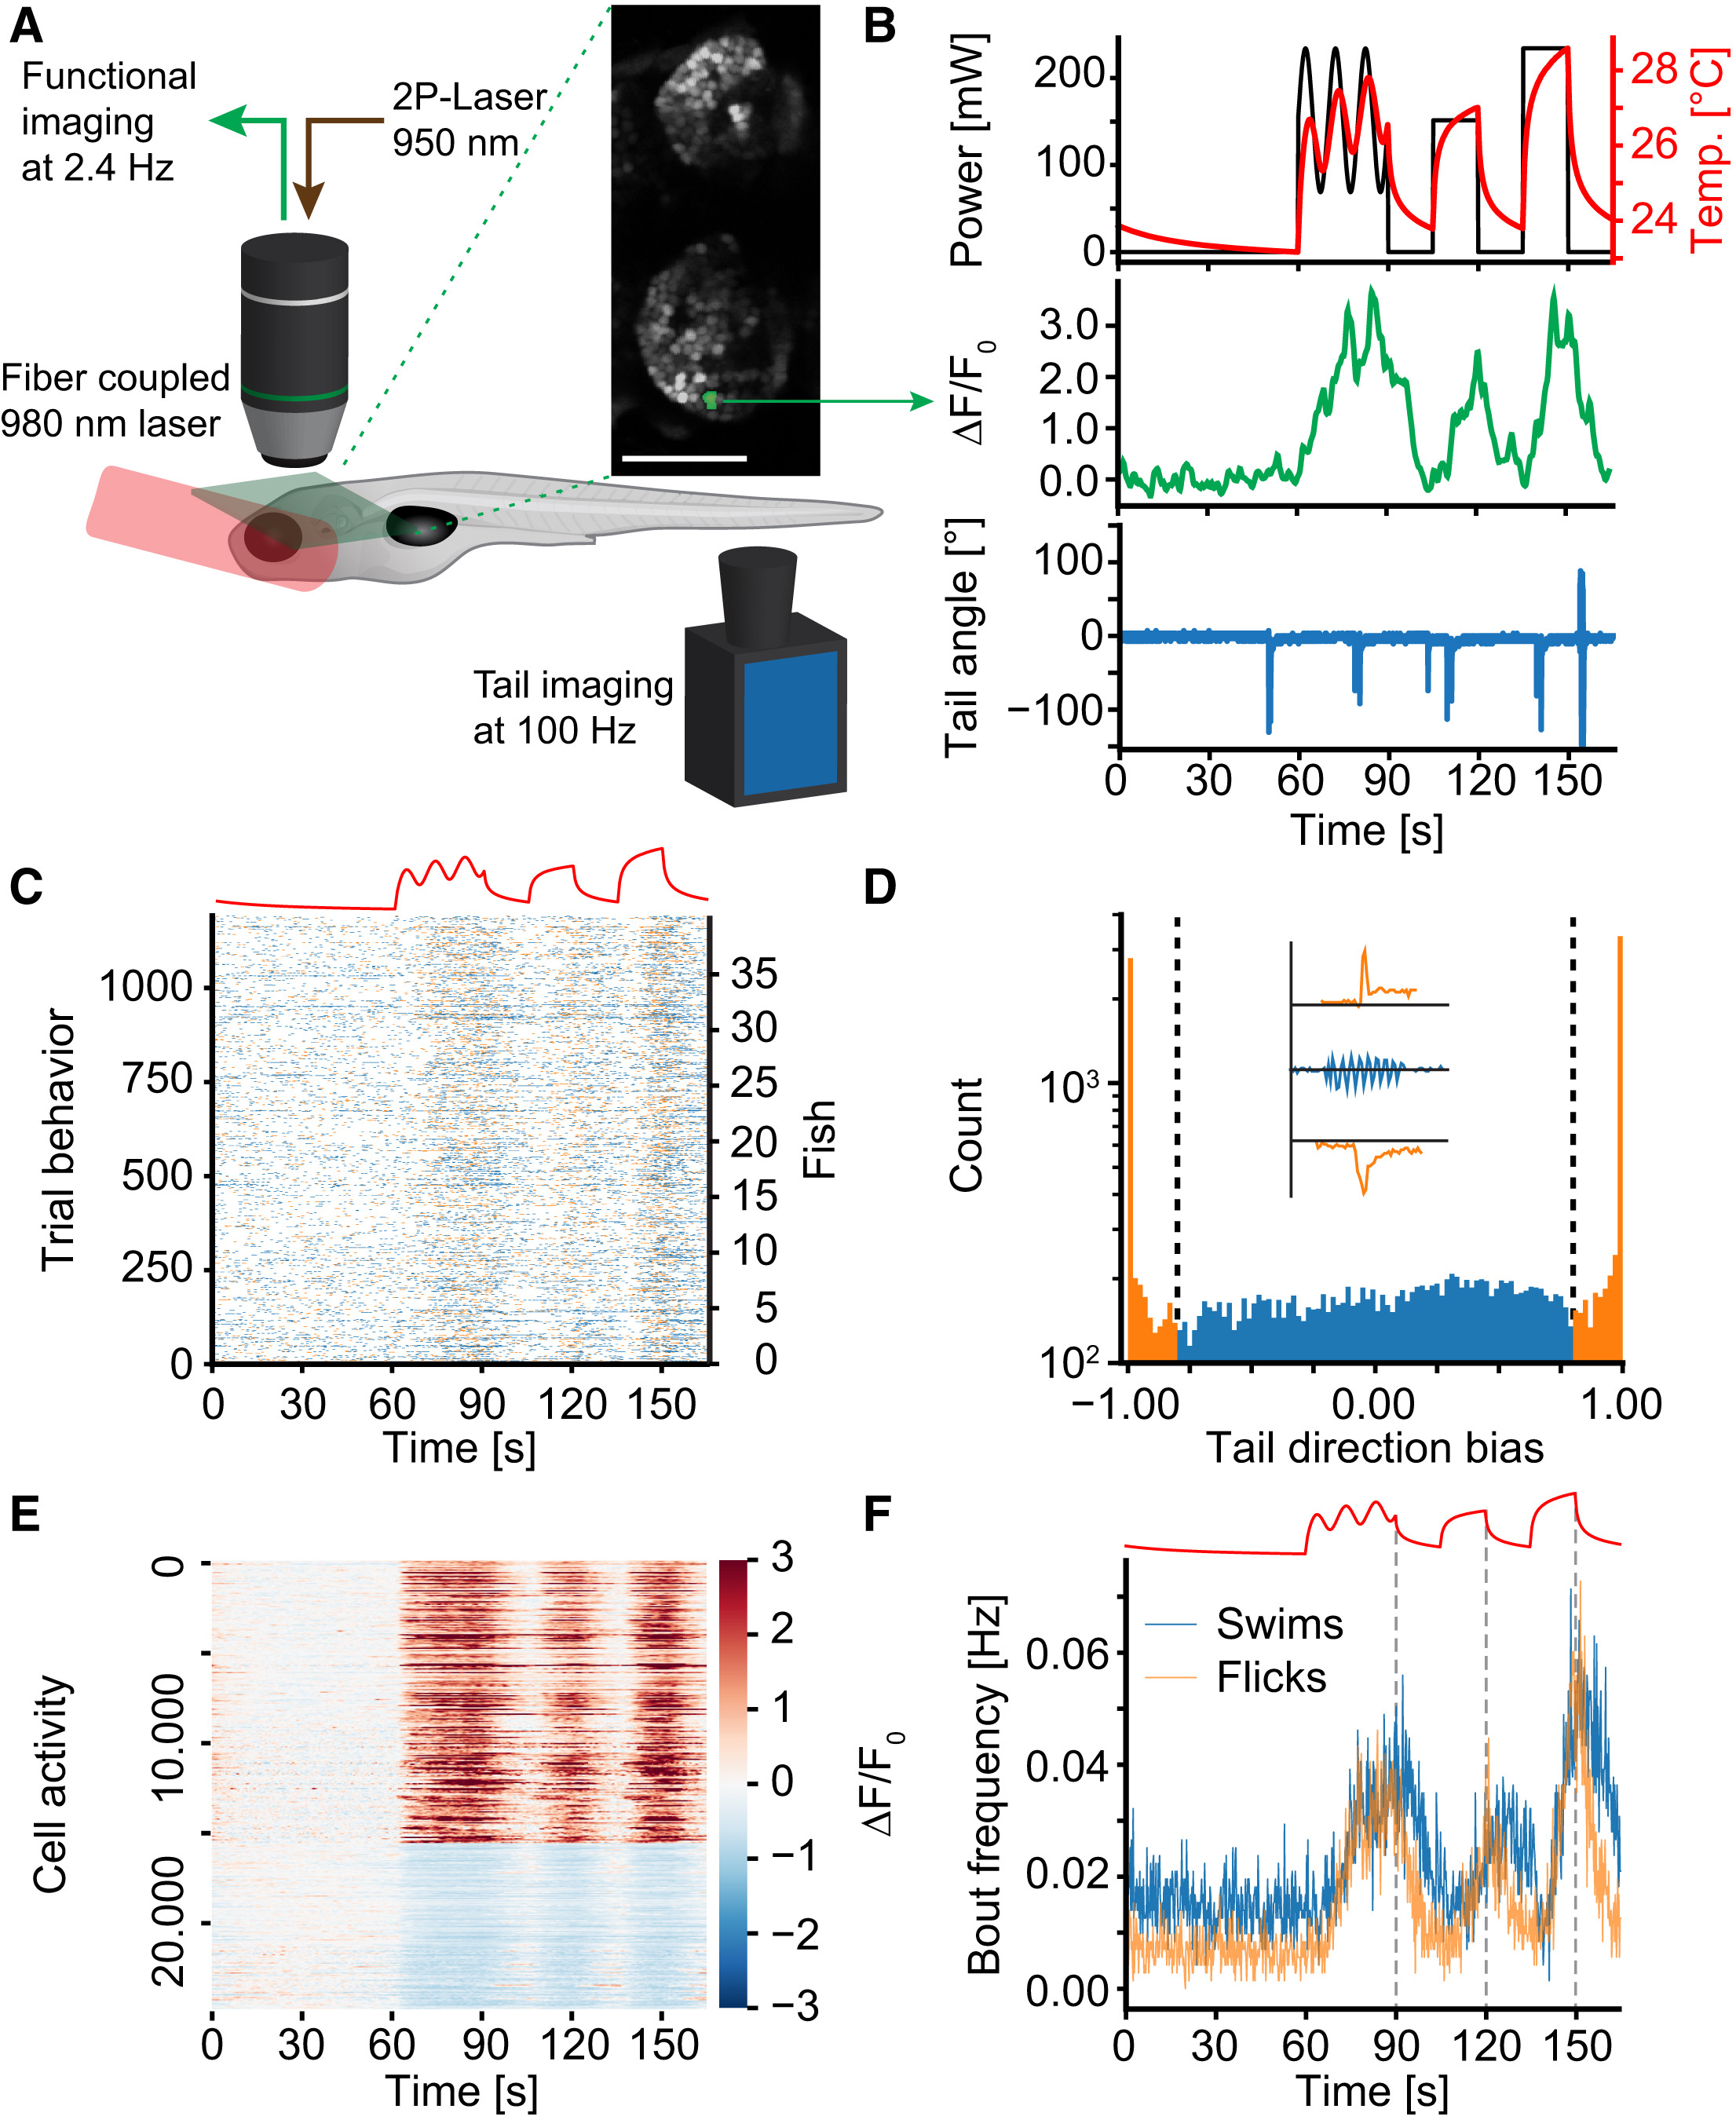
A Paradigm to Probe Heat Perception in Larval Zebrafish
(A) Setup schematic. Green plane depicts example imaging plane and inset shows habenulae imaged in one experiment. The activity of the green nucleus is depicted in (B).
(B) Top shows the delivered laser power in each repeat (black line) as well as the repeat-average temperature experienced by the fish (red line). Middle depicts repeat averaged calcium activity of one example ON cell. Bottom depicts example tail-trace during one repeat of one imaging plane.
(C) Behavior raster plot (summed across repeats) of 1,200 planes imaged across 40 fish. Blue ticks identify the start of swim bouts, orange ticks the start of flick bouts. Stimulus depicted on top for reference.
(D) Histogram of directional bias (see STAR Methods) of tail movement across all bouts in 40 fish. Coloring and dashed lines reflect cutoff between “flick” and “swim” categories. Inset shows example tail traces during flick to the left (top), swim (middle), and flick to the right (bottom).
(E) Heatmap of trial-averaged activity of all heat-responsive cells across all experiments. Cells are sorted according to ON versus OFF criteria. Color scale indicates ΔF/F0.
(F) Average bout frequencies of flick (orange line) and swim (blue line) type bouts. The stimulus is depicted on top for reference. Dashed gray lines indicate start of temperature decline to reveal off response in swims.
See also Figure S1.