
Image
|
Figure Caption
Fig. 2-S1
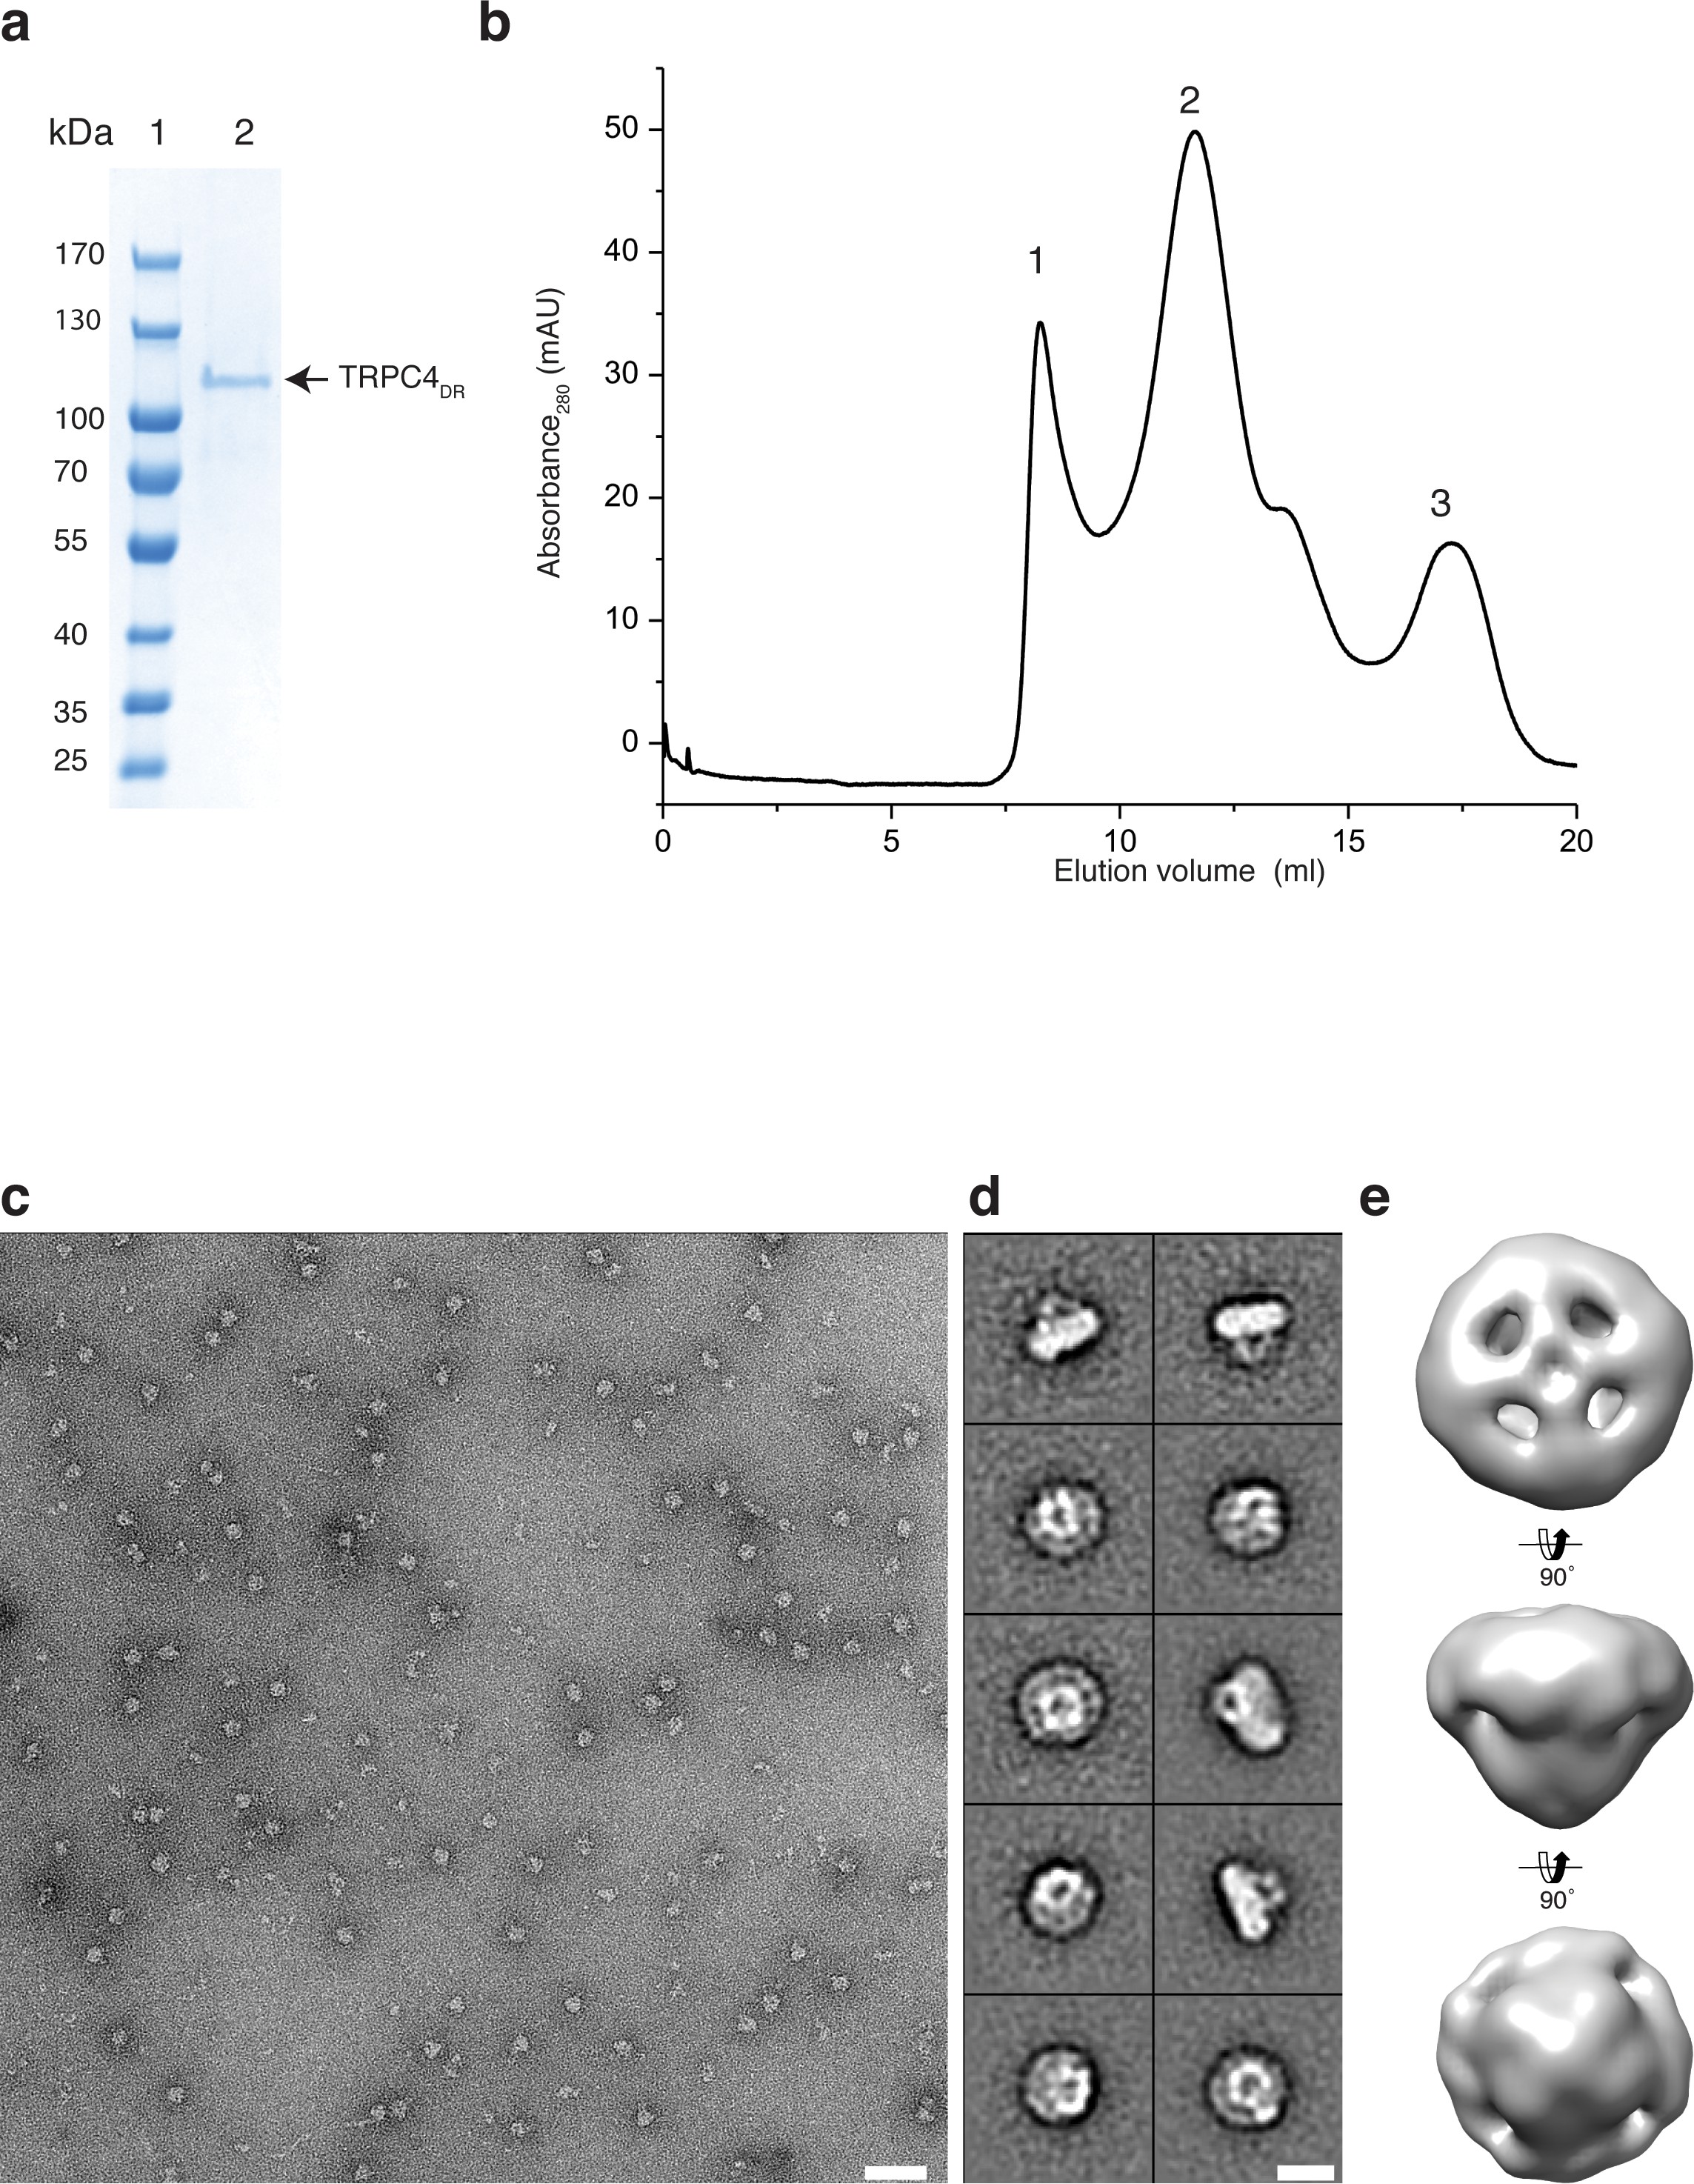
Purification of TRPC4DR and negative stain EM of TRPC4DR in amphipols.
(a) SDS-PAGE of the peak fraction of TRPC4DR in amphipols after size exclusion chromatography. Lane 1: molecular weight marker, lane 2: protein. (b) Size exclusion chromatography profile of TRPC4DR in amphipols. Peak 1, 2 and 3 correspond to the void volume, tetrameric TRPC4DR and cleaved GFP, respectively. (c) Representative negative stain electron micrograph of TRPC4DR. Scale bar, 50 nm, (d) Representative 2-D class averages. Scale bar, 10 nm. (e) 3-D reconstruction of negatively stained TRPC4DR shown in different orientations.
Acknowledgments
This image is the copyrighted work of the attributed author or publisher, and
ZFIN has permission only to display this image to its users.
Additional permissions should be obtained from the applicable author or publisher of the image.
Full text @ Elife