Fig. 2
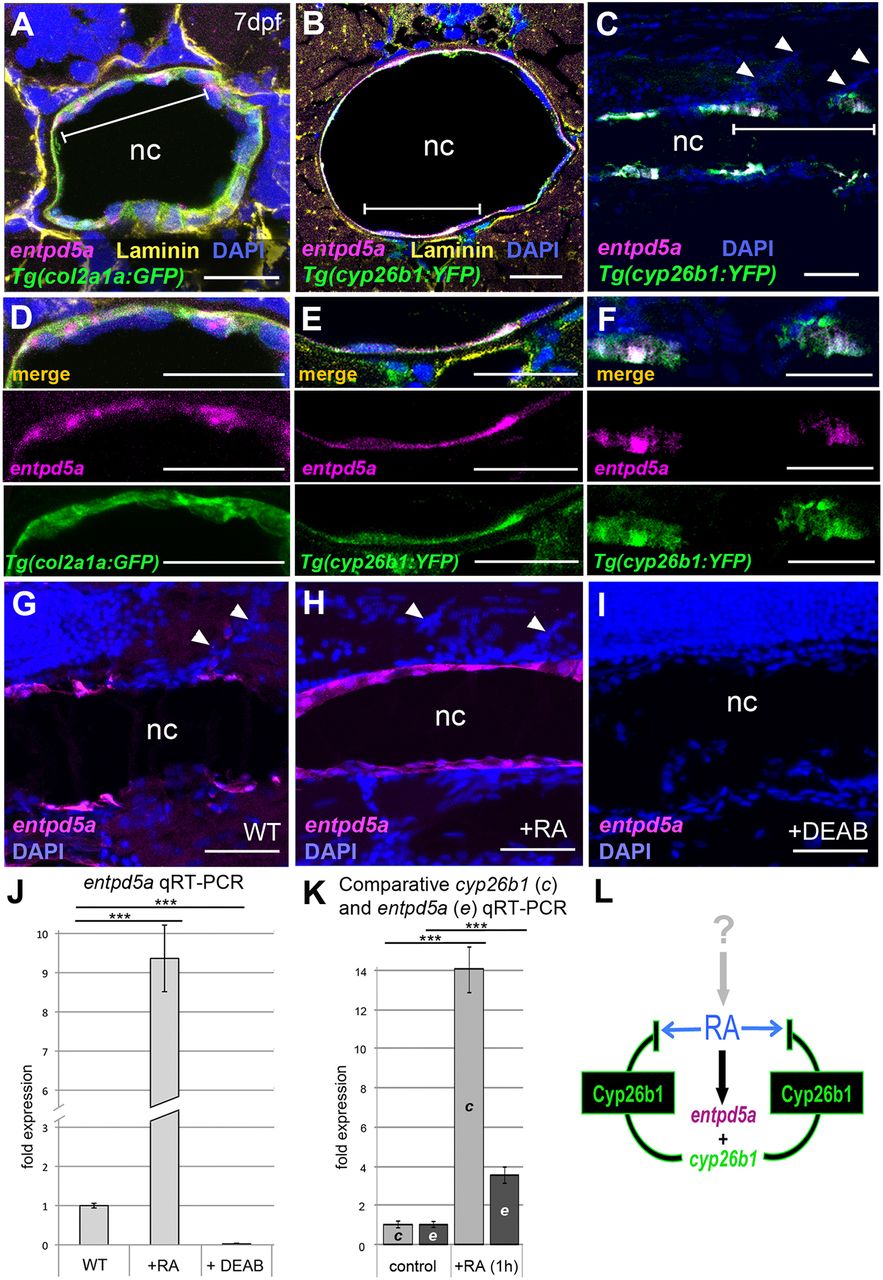
cyp26b1-positive chordoblasts co-express the biomineralization gene entpd5a in an RA-dependent manner. (A-I) In situ hybridization for entpd5a transcripts (magenta) on transverse (A,B,D,E; level of chordacentra) or sagittal (C,F,G-I) notochord sections of wild-type (A-F), control- (G), RA- (H) or DEAB-treated (I) larvae at 7 dpf, co-labeled with DAPI (blue), anti-Laminin (yellow), anti-Tg(R2-col2a1a:EGFP)-derived EGFP (green) and/or anti-Tg(cyp26b1:YFP)-derived YFP immunofluorescence (green). (D-F) Magnifications of the areas demarcated by brackets in A-C. Upper panels of D-F show cognate images of merged channels, middle and lower panels single channel images for entpd5a expression (magenta) and anti-GFP or anti-YFP immunofluorescence (green), respectively. Scale bars: 20 µm (A,B,D,E); 50 µm (C,F,G-I). Arrowheads (C,G,H) indicate somite borders. (J) qRT-PCR analysis of entpd5a transcript levels in trunks of 7 dpf larvae after 3 days of RA or DEAB treatment (n=30 per condition); mean±s.d.; ***P<0.0001. (K) qRT-PCR analysis of cyp26b1 and entpd5a transcript levels in trunks of 5 dpf larvae after 1 h of RA treatment (n=20 per condition); mean±s.d.; ***P<0.0001. (L) Schematic model of the molecular events at a forming chordacentrum: RA, generated and regulated by thus far unknown cells and upstream factors, co-induces chordoblast-specific expression of entpd5a and cyp26b1. Cyp26b1 enzyme inactivates RA at its site of action to restrict lateral spreading of the signal and to ensure physiologically appropriate RA concentrations. nc, notochord.

