
|
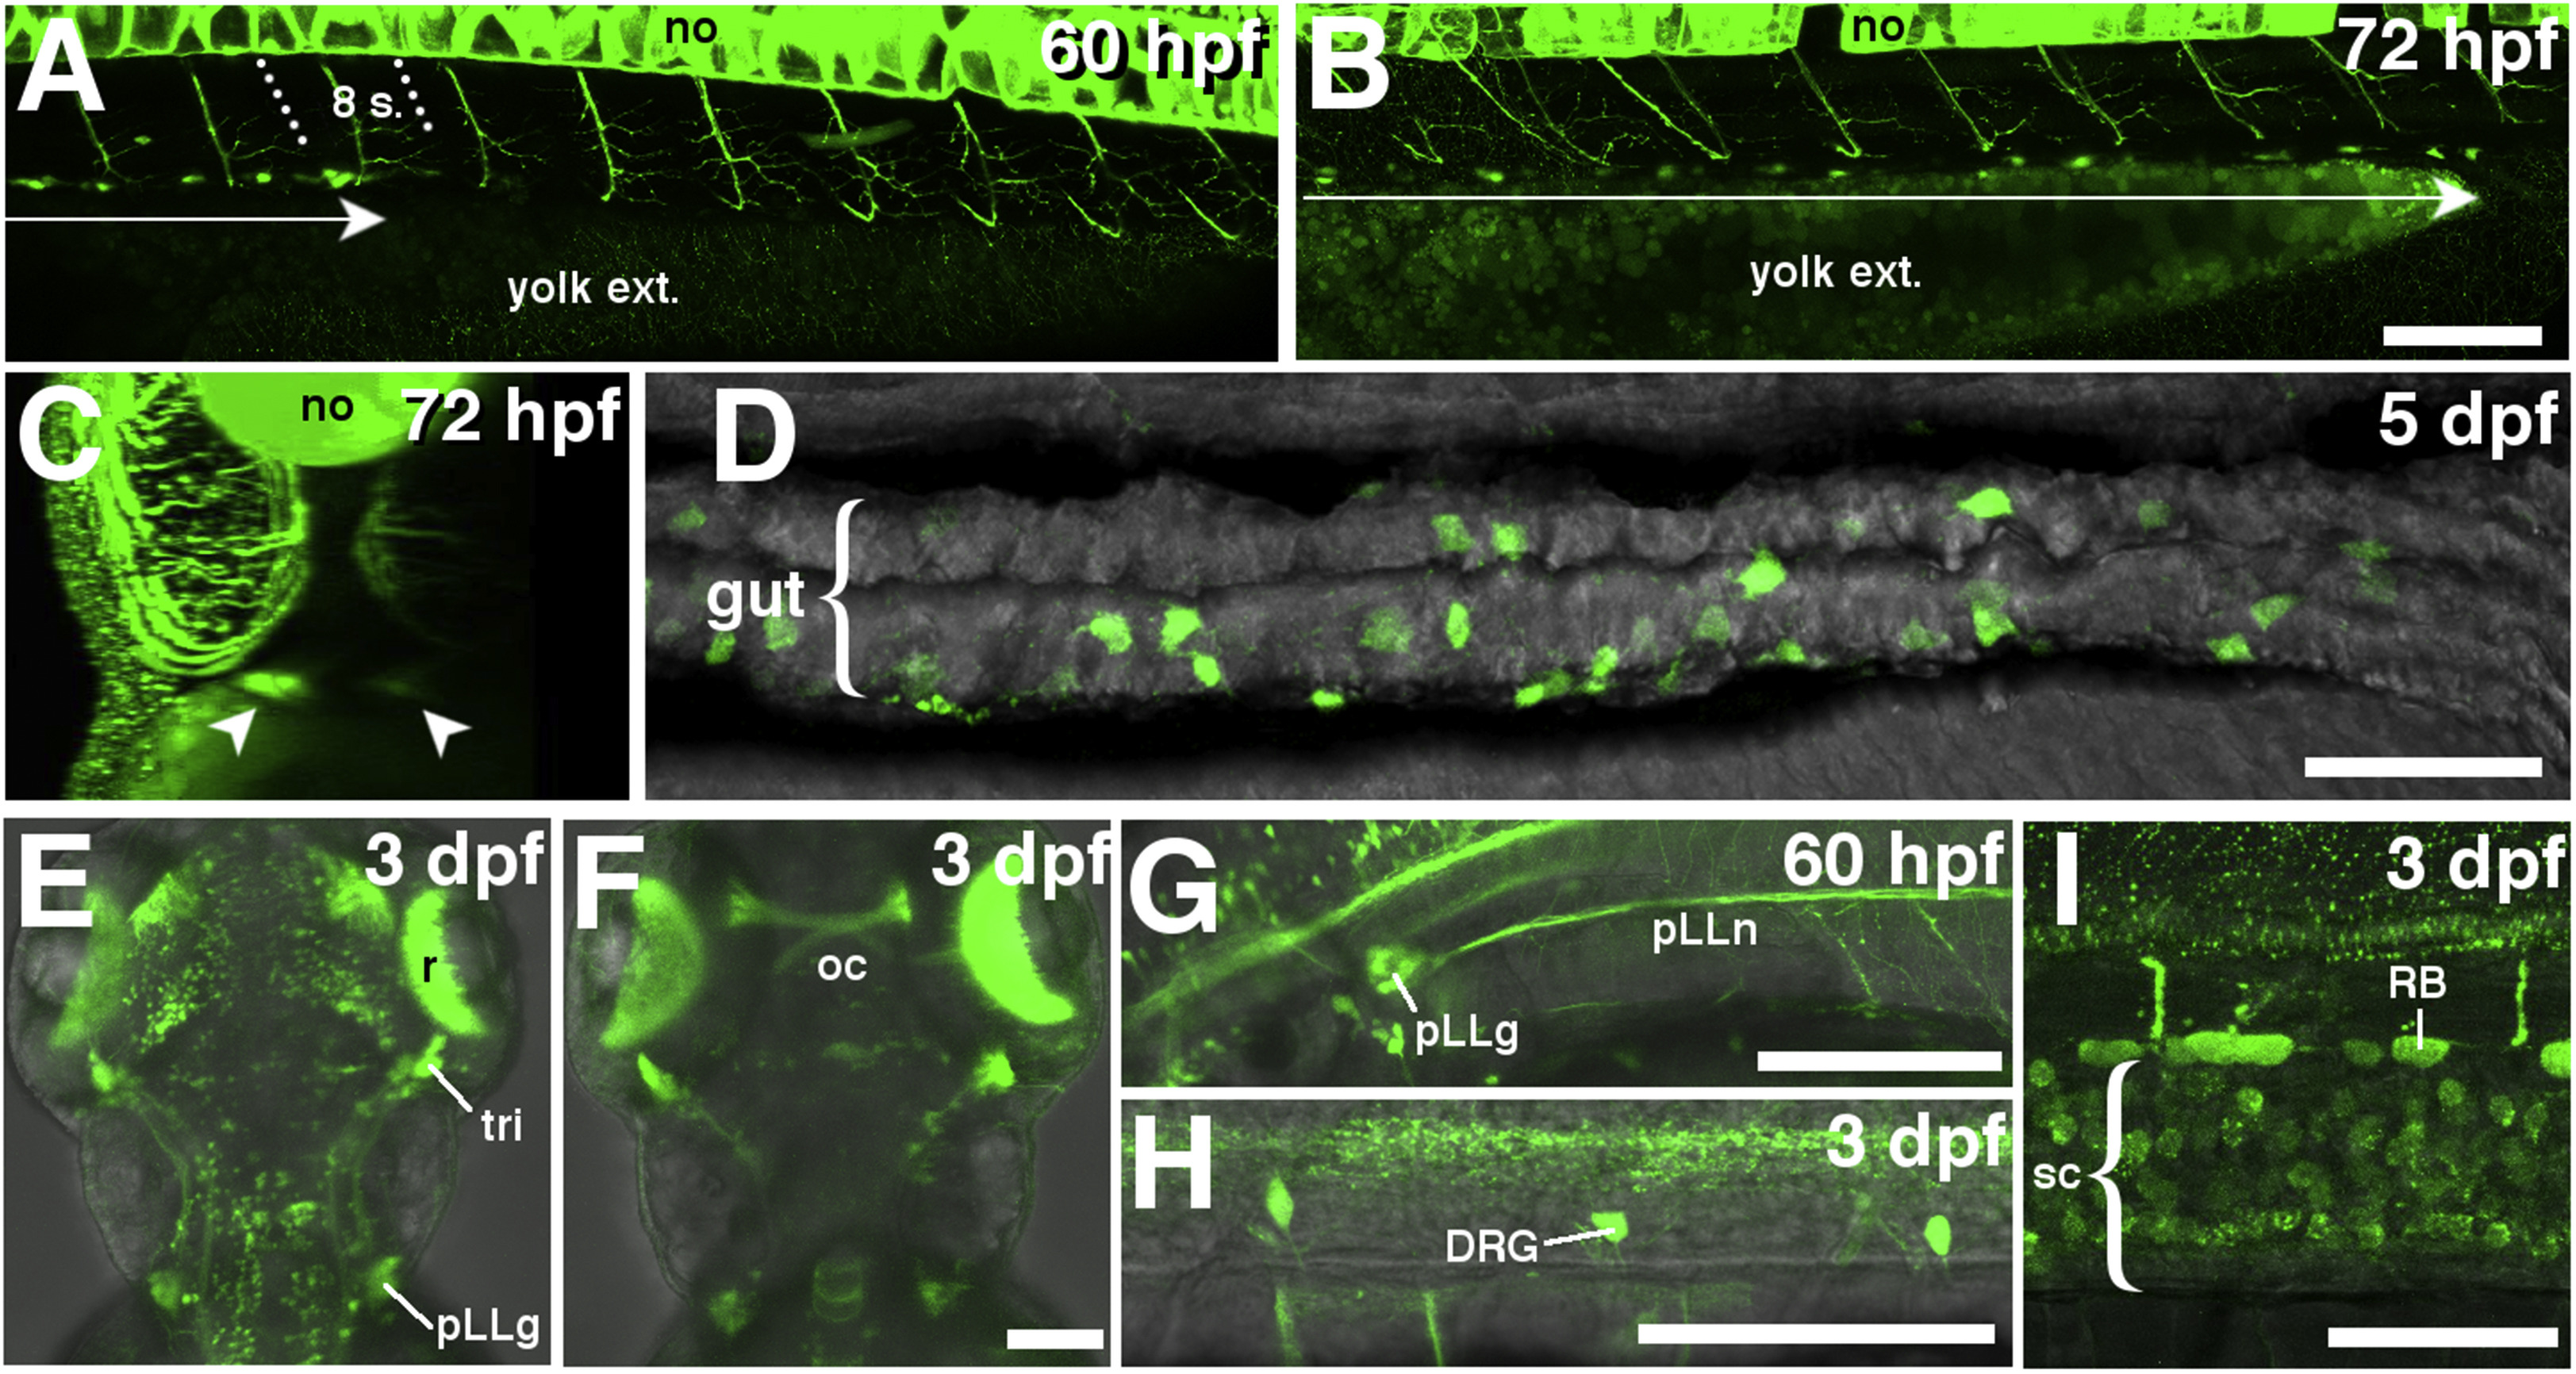
Fig. 2
Expression pattern of GFP in the Tg(chata:GGFF2). A: Distribution of GFP + cells as a pair of one-dimensional rows in the anterior gut primordium at 60 hpf. These cells were restricted anteriorly to the 8th somite (arrow). Panels A, B, D are lateral projection views. Anterior: to the left. B: At 72 hpf, the distribution of GFP + cells as a pair of one-dimensional rows was expanded to near the posterior end of the gut. C: Frontal projection view made from the same data as those in panel B shows bilaterally distributed GFP + cells (arrowheads). D: At 5 dpf, at the level of distal intestine, GFP + cells were distributed around the developed gut tube. E, F: At 3 dpf, the dorsal views with anterior to the top show GFP is expressed in retinal ganglion cells and optic nerves, trigeminal ganglia, and posterior lateral line ganglia. G: The posterior lateral line nerve is GFP + at 60 hpf. H, I: At 3 dpf, dorsal root ganglia and Rohon-Beard neurons are GFP+ in addition to neurons in the spinal cord in trunk. 8s: 8th somite, DRG: dorsal root ganglia, no: notochord, oc: optic chiasm, pLLg: posterior lateral line ganglia, pLLn: posterior lateral line nerve, r: retina, RB: Rohon-Beard neurons, tri: trigeminal ganglia, sc: spinal cord, yolk ext.: yolk extension. Scale bars: 50 μm.
Reprinted from Gene expression patterns : GEP, 28, Nikaido, M., Izumi, S., Ohnuki, H., Takigawa, Y., Yamasu, K., Hatta, K., Early development of the enteric nervous system visualized by using a new transgenic zebrafish line harboring a regulatory region for choline acetyltransferase a (chata) gene, 12-21, Copyright (2018) with permission from Elsevier. Full text @ Gene Expr. Patterns