
|
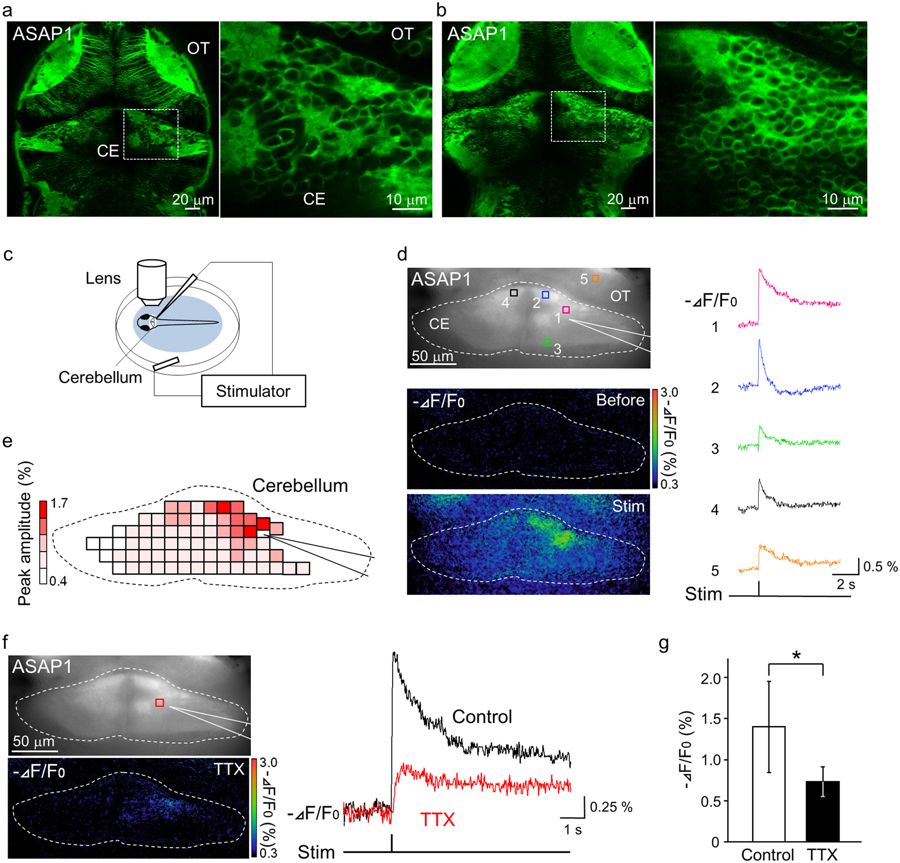
Fig. 5
Neuronal activity in the cerebellum and optic tectum was detected by ASAP1 imaging. (a,b) Membrane-localized ASAP1 was observed in the cerebellum and optic tectum. Dorsal view of Tg(elavl3:GAL4-VP16;UAS:ASAP1) fish brain at 6 dpf (a) and 9 dpf (b). Higher magnification images are shown to the right. CE: cerebellum, OT: optic tectum. (c–e) The evoked depolarizations in the cerebellum and optic tectum were detected by ASAP1 imaging. (c) Schematic diagram of the electrical stimulation system. (d) (Top left) A fluorescence image of the cerebellum of Tg(elavl3:GAL4-VP16;UAS:ASAP1) fish. (Bottom left) Images of changes in ASAP1 fluorescence before and 0.14 sec after the stimulation. Changes in fluorescence (−ΔF/F0) are indicated by the pseudocolor scale shown at right. (Right) ASAP1 signals produced by electrical stimulation of the cerebellum. Traces indicate signals detected at the 5 numbered locations indicated in the top-left image. ROI5 is located in the optic tectum. (e) Response map of the cerebellum. The peak amplitudes of the fluorescence changes in the cerebellar neurons upon stimulation are encoded by the pseudocolor scale shown at left. (f) The depolarizing signal measured in the cerebellum was reduced by tetrodotoxin (TTX) treatment (left bottom). Results from the same fish are shown in (d) and (f). Traces indicate signals detected at the location indicated in the top left image. (g) The mean peak values of the responses were significantly reduced after TTX treatment (*p < 0.01). This indicates that the depolarizing response represents neuronal activity in the cerebellum and optic tectum.